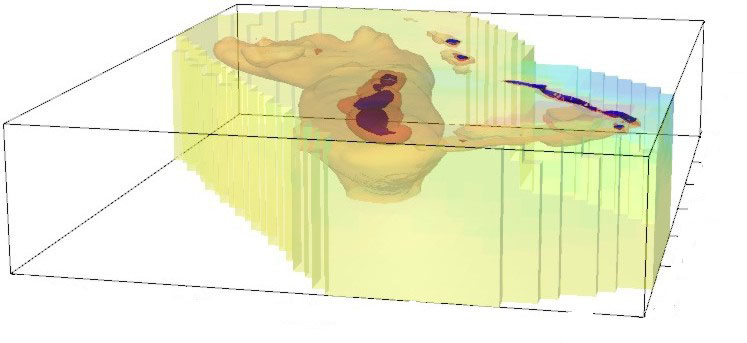
This is the new 3D Geothermal
Outflow Mapping "Power Tool".
This 3D DC resistivity imagery of an entire active hydrothermal system is remarkable for its insight-packed depth and scale. Three times deeper than any other True 3D mapping method, and 1/3 the cost.
Never compromised on data quality, over 10,000 actually useable True 3D measurements (385 complete and unique 54 km2 potential fields) provided comprehensive 3D hard-data constraint for the 3D inversion, esuring highly reliable dimensional geometry.
The nightly-updated true 3D progress imagery can be shared with the client in real time, ensuring that no emerging "margin-area anomaly" is allowed to go unresolved before crew demobilization.
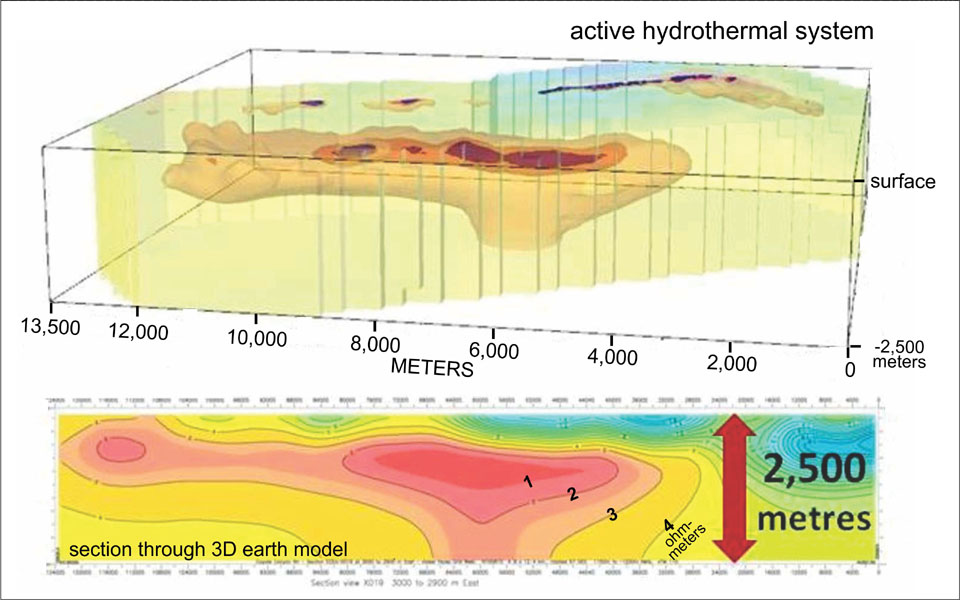
Lithium brine targeting strategy is the opposite to that employed for geothermal production fluids.
 This 3D DC resistivity imagery of an entire active hydrothermal system is remarkable for its insight-packed depth and scale.
Three times deeper than any other True 3D mapping method, and 1/3 the cost.
 Never compromised on data quality, over 10,000 actually useable True 3D measurements (385 complete and unique 54 km2 potential fields) provided comprehensive 3D hard-data constraint for the 3D inversion, ensuring highly reliable dimensional geometry and resolution.
The nightly-updated 3D survey progress imagery can be shared with the client in real time, ensuring that no emerging "margin-area anomaly" is allowed to go unresolved before crew demobilization from the site.
LITHIUM TARGETING
The hydrothermal system image at right is not closed off, so that the brines are likely to be flushed steadily. There is little or no opportunity here for lithium concentration to be achieved by evaporation, as in a closed no-outlet reservoir.
If a system signature such as this was acquired in a closed (no-outlet) environment, it could be prospective for lithium. The selection of primary sampling targets for lithium extraction would be quite different from those selected for power development. The highest temperature, maximum-flow characteristics for geothermal power likely are associated with the 2 Km wide, deep upwelling feature, to be sampled at drilling depths extending through the bottom of the 3D model (at 2,500m). This fluid would be of the least interest for lithium, as it is newly arriving, with low (if any) lithium content, headed towards the shallower circulating, concentrating environment. For lithium, areas of greatest conductivity (deep red) would be sampled first, at depths of about 1,000m, as an initial guess as to which areas of the closed circulating system might host the greatest concentration of lithium.
- SUMMARY
REVIEW
- - EVOLUTION OF
EXPLORATION
TECHNOLOGIES - RECONNAISSANCE
wide area 2D mapping
3pS mapping - RECONNAISSANCE
valley-bottom lines
and LINEAR E-SCAN - DRILL TARGETING
investigating any
reconnaissance anomaly - DRILL TARGETING
high resistivity zoning
in geothermal systems - RESERVOIR
MANAGEMENT
4D E-SCAN
Resistivity mapping for geothermal resources
SUMMARY REVIEW
Ground-operated DC resistivity techniques are applied on a regional reconnaissance scale over hundreds of square kilometers. More detailed follow-up of identified target areas may span several tens of square kilometres. A single geothermal system anomaly often spans many kilometres in width, and several in depth. Conductive outflow plume anomalies have been mapped as far as 20 kilometres from their upwelling source locations. In comparison to most mining geophysics, this resource mapping application is on a scale that is 1 to 2 orders of magnitude larger. Appropriately scaled geophysical survey techniques are therefore designed and applied.
Until two decades ago, outlining a geothermally-prospective conductive anomaly represented the limit of geophysical capabilities. Consequently, drilling (as an exploration tool) commenced at an early stage, often starting with thermal analysis "slim bore" holes, for example absolute bottom-hole temperature, temperature gradient, heat-flow calculations. As the accumulating data and interpretations indicated the hottest and most permeable target zones within the anomaly system, large bore test wells would then be drilled.
Today there are true 3D geo-electric survey techniques that can map structure and zoning within and beneath the typically broad conductive alteration envelope of a geothermal system, providing more specific initial drill targeting guidance. Expanding upon previously conductivity-focused investigations, the resolution of a resistive core within a conductive envelope is being proposed as a predictor of the centre of highest temperature (and possibly best productivity) in some geothermal settings (Anderson et al, 2000).
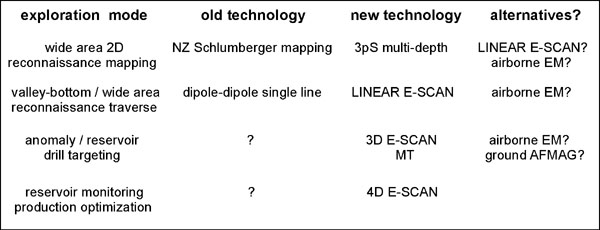
Electrical resistivity tools for geothermal exploration:
Reconnaissance stage: Reducing broad areas to manageable target zones of interest, e.g. 5 to 35 square kilometres in extent. The traditionally successful tools are New Zealand style Schlumberger array mapping, and dipole-dipole array single-line traverse surveys. Newer technologies build on their track record, improving both interpretability and performance, especially in rougher terrain. The application of airborne EM to some exploration phases is receiving increasingly favourable review.
Drill targeting stage: Resolving drill targets within a geophysically-indicated geothermal anomaly system. Historically, every electrical geophysical technique has been applied for this purpose, with none appearing to demonstrate reliably consistent success in defining sub-area preferential targets. Newer technologies and interpretation approaches (such as 3D E-SCAN) are making progress.
The use of airborne EM for reconnaissance purposes, including outflow plume mapping where modest depth penetration is sufficient, has all but been ignored. Developments in deeper EM performance (e.g. AFMAG-based ZTEM®) and an understanding of how to employ shallow-depth airborne reconnaissance applications may be changing this.
Evolution of electrical resistivity technologies for geothermal exploration
The period 1960 through 1990 saw high levels of geothermal exploration world-wide, peaking in the 1980's with the oil shortage.
In North America, the accepted method for geothermal exploration geophysics was the dipole-dipole resistivity traverse, which was applied across widely-spaced lines where possible, and in single lines where terrain would permit nothing else. Single line dipole-dipole surveys produced exploration successes, despite very sparse data and ambiguities in interpretation. In New Zealand, the presence of many roads and trails in the Taupo Volcanic Zone provided access for a locally-developed method of continuous single-depth resistivity mapping which continues to be used today, employing overlapping, fixed-spacing Schlumberger array measurements. Schlumberger mapping, tuned specifically for local geologic conditions, produced many exploration successes in New Zealand.
Other more complex approaches were tried, but none attained widespread use.
Both of these reconnaissance methods were adapted and employed elsewhere. Dipole-dipole survey results appear in reports from western Canada, Japan, Italy, the Philippines, Indonesia, Central America and many other places. The NZ method was adapted for use in laterally delineating the Meager Creek geothermal resource in British Columbia. The adapted method was also applied on the flanks of Mt. Baker, Washington, and more recently on geothermal mapping projects in Oregon and Nevada. Common to both of these reconnaissance approaches is the simple objective of locating anomalous conductive values of significant volume and lateral extent, within a much larger prospective region. The detailed examination and characterization of the located anomalies was treated as a separate exploration issue, using different methods.
To the extent that geothermal system signatures were actually detected and laterally constrained, DC resistivity established itself as a useful exploration tool. The sophistication of accurate 3D imaging of anomaly envelope shapes and internal structures, and the discrimination of (more resistive) high-temperature centers within conductive alteration zones would not emerge until toward the end of the century.
These advanced detailing techniques still depend upon the prior identification and location of a geothermal anomaly by some less costly, regional-scale method. Without this preliminary delineation of an area of interest, the cost of the necessary wider application of modern 3D imaging would be prohibitive. As a result, The Schlumberger mapping and dipole-dipole profiling styles of reconnaissance geothermal mapping continue to be used today, both in their original formats and in updated variants.
Today, 3-point Schlumberger "3pS" mapping extends the NZ capability into extreme terrain conditions, delivering more deployment flexibility to this low-cost application. 3-point measurements add an element of vertical gradient mapping as an aid to interpretation in settings that are less predictable than the original Taupo Volcanic Zone application area.
LINEAR E-SCAN updates and obsoletes most dipole-dipole traversing by providing much-needed en-route spatial verification of the source location for any conductive anomaly observed along the traverse route. LINEAR E-SCAN also significantly increases the along-line swept volume by an order of magnitude over dipole-dipole, covering more ground to greater depths on each line traverse.
Some of the applications now managed by these reconnaissance techniques may be supplanted by lower-cost, equally effective airborne EM programs.
In the area of anomaly characterization, a.k.a. reservoir delineation, the 3D E-SCAN mapping tool represents the state of art in identifying and resolving any geo-electric zoning and linear variations within an anomaly, while providing high-resolution imagery of the outer surfaces of the anomaly. This can include the detection and imaging, on the underside of a conductive anomaly, of a continuing-deep extension that may represent the site of an inflow conduit.
The integration of 3D E-SCAN follow-up as part of the LINEAR E-SCAN reconnaissance mapping system adds true 3D anomaly location and characterization, en-route, in-situ, in real time, producing potentially drill-ready anomaly targeting during a brief interruption to the ongoing LINEAR E-SCAN reconnaissance mapping progress. The LINEAR + 3D E-SCAN approach has the advantage of compressing the usually separate stages of reconnaissance surveying and later anomaly confirmation and evaluation into a single, cost-effective field event. In many cases, this will allow the compression of several seasons of traditional exploration into single month-long period.
In a more difficult adaptation, it is possible that some of the advantages expected for reconnaissance mapping with airborne methods may be applicable to the deeper, more difficult challenges of conductive anomaly characterization, i.e. discrimination of a deep-going conductive anomalous body from an area of surficial conductivity. Preliminary indications suggest that airborne AFMAG-based systems may have some advantage here, even if the initial purpose is simply to pre-qualify sites prior to a commitment to more comprehensive (and expensive) ground-based evaluation with 3D E-SCAN.
Citation to be added.
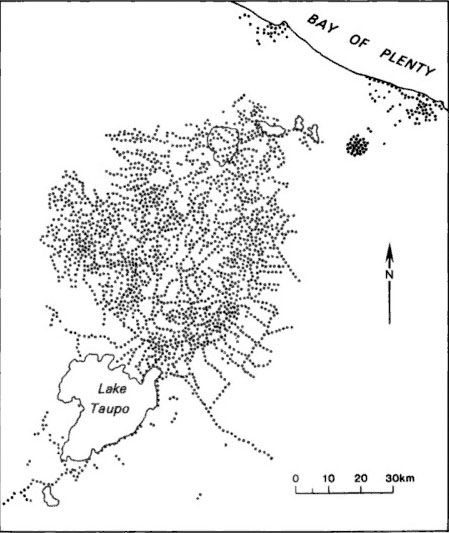
are contoured to present this image covering New Zealand's Taupo Volcanic Zone.
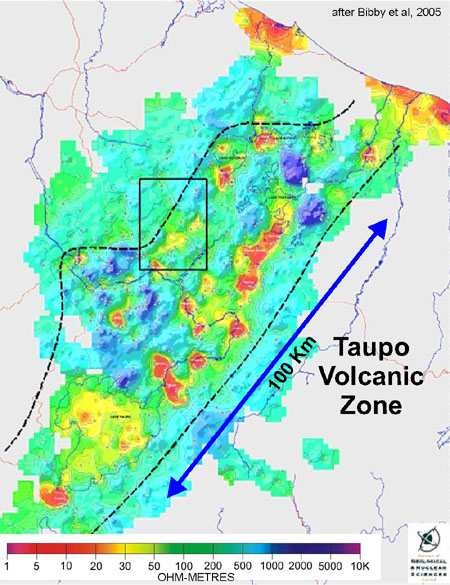
Schlumberger area mapping - 2D pattern generation
"Perhaps the most successful application of electrical resistivity techniques for delineating geothermal systems has been in the early exploration of the Taupo Volcanic Zone of New Zealand.
"Systematic mapping using the Schlumberger resistivity arrays with fixed spacings has identified 23 individual geothermal systems with well-defined boundaries." (Bibby et al, 2005)
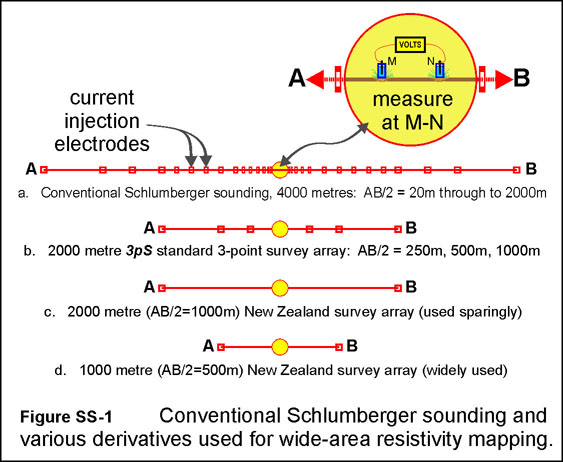
Using available roads and trails, the decades-long New Zealand project collected resistivity data using simple Schlumberger arrays with AB/2 spacings of 500m and sometimes 1000m. The preferred AB/2 array spacing of 500 metres (nominal depth of investigation of about 190 metres) was selected on the basis of observations that it produced the greatest contrast in electrical resistivity across the boundary of a selection of observed high-temperature geothermal systems (Bibby et al, 2005).
The success of the method in New Zealand is in part due to the uniformity of resistive young volcanic coverage throughout the area, providing good electrical resistivity contrast between non-geothermal areas (at around 100 ohm-metres) and the highly-conductive altered conditions over geothermal systems (5 to 30 ohm-metres). all within the first 250 metres of depth that is sampled by the AB/2=500m Schlumberger array measurements.
The array design was thus "calibrated" against known local geologic conditions, an always prudent and sometimes critical aspect of exploration planning.
In contemplating application of this exploration mapping method in different conditions, one must obviously consider the new setting's characteristics and adjust survey parameters and interpretation considerations to maximize the chances of delivering useful exploration information.
Meager Creek Geothermal Area, British Columbia. When Schlumberger mapping was considered as a means of closing off the upslope conductive anomaly at the Meager Creek geothermal project, it was known that there would be no uniform resistive layer within which to easily see alteration anomalies. Exposed rocks in the Meager Volcanic Complex ranged from extensively weathered volcanics, to fresher flow rocks, to areas of exposed crystalline rocks, interspersed with glacier ice, snowfields and loose debris. It was decided that if we were going to spend the money and effort to access survey layout positions (mostly by helicopter), we would measure three points, not one, to maximize accumulated information. We did not have the benefit of local examples of geothermal systems on which to test array results. However, at the time, we Canadians encouraged by Peter MacDonald of the NZ DSIR to remember that (roughly recalled) - "an active geothermal system will have spent a long time vigorously assaulting the overlying rocks with various hot acidic gases and thermal fluids that will in time substantially alter any type of overlying rock. The alteration signature should be there for the mapping." ... Indeed it was.
3pS on Mount Baker, Washington State Operating conditions on Mt. Baker are significantly better than those in the Meager Volcanic Complex. Conditions are similar to those at other Cascades volcanoes like Rainier and Shasta, with road systems in most of the valley bottoms, and a tracery of logging roads providing access upslope in many areas. One area of interest on the southwest slope of Mount Baker surrounds a hot springs camping area. A 3pS survey was conducted on logging roads throughout the area of interest, but did not encounter any anomalous conductivities that would signal either a direct resource hit or an outflow plume to be tracked upslope.
3pS at Crump Geyser, Oregon 3pS survey at Crump Geyser covered a large area in the valley, eventually establishing a partial boundary for the conductive conditions that enclose the geyser site.
3pS in Nevada A 3pS survey was undertaken at Salt Wells, near Fallon, Nevada, mapping conductive patterns through and around the Bunejug Mountains, and extending over the flats to Highway 50. Numerous 3pS-suggested full Schlumberger vertical electrical soundings (VES) helped confirm interest in certain anomalous sub-areas, inviting further investigation. Part of this area was also subjected to a full 3D E-SCAN survey in a location selected on the basis of an independent, geology-derived deep structural model.
At Black Warrior, 3pS survey confirmed an extremely large area of probable thermal conditions, probability based on interpretation of the absolute conductivity values and the vertical ratios of the 3-point measurement sets. Complete Schlumberger vertical electrical soundings (VES) were applied in 3pS-indicated areas of interest to verify conditions at depth. The 3pS and VES surveys were unaffected by the high-voltage Pacific Intertie power line that bisects the property.
Plotting and reporting field data
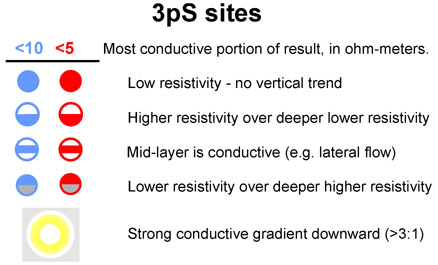
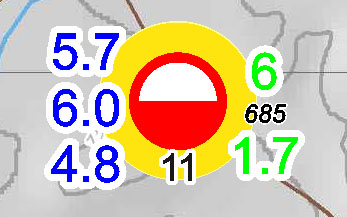 Using a standardized field procedure and standardized coded icons
for plotting, the survey results offer several ways to visualize groupings and evaluate the significance of different measured responses across the
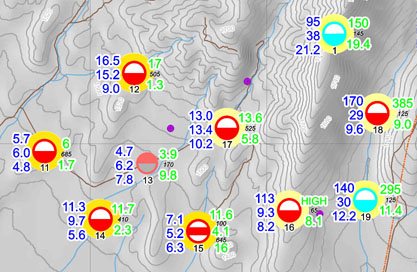
property. At right, the fully-annotated "resistive-over-conductive, less than 5 ohm-metres" icon relates to station serial number 11.
AB/2 measured values for 250m, 500m and 1,000m are 5.7, 6.0 and 4.8 ohm-metres (apparent resistivity), respectively.
A 1D inversion of the three measured data delivered a two-layer earth model of 6 ohm-metres transitioning
at 685 metres below surface to 1.7 ohm-metres (true resistivity).
The strong vertical ratio of more than 3:1 earned a yellow emphasis annulus. The permissible 1.7 ohm-metre deeper zone is a potentially significant
response in a known geothermal area; it's possibility is not intuitively suggested by the very average looking measured values of 5.7, 6.0 and 4.8.
 Mouse-over the image at right to see this station plotted in the context of several surrounding stations.
Plotted data may be grouped according to common aspects, especially those suggestive of geotehrmal conditions, whether deep, large volume bodies or lateral outflow plume signatures. VES soundings are plotted in-position on the same maps. The intention is to identify a smaller percentage of the surveyed area as geothermally prospective, as part of first-pass measures toward more efficient planning of temperature gradient drilling and other programs.
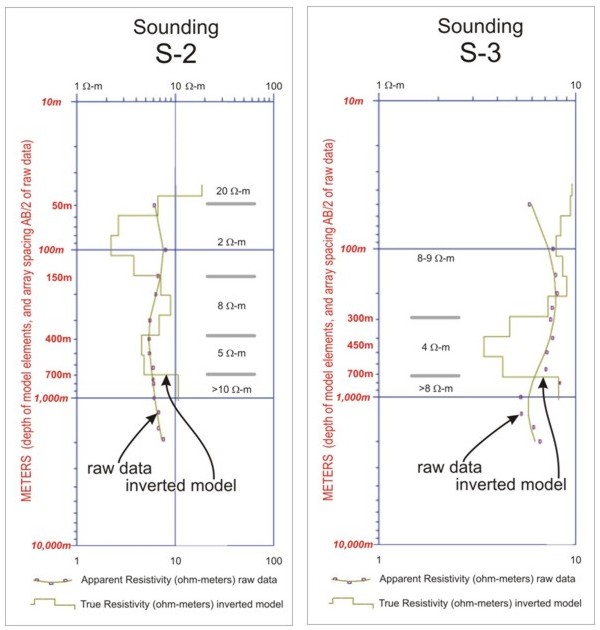 Full Schlumberger soundings employ 10 to 30 or more measurements based on expanding the current injection electrode (AB) spacing from ten metres (shallowest sample)
to many kilometres separation for the deepest sampling. Expansion is usually roughly logarithmic. 1D inversion programs provide a computed layered earth (1D) model
for the measured data.
The images here show the measured (raw) data, the vertical profile (inverted model) provided by the inversion algorithm, and a simplified listing of the principal 2 or 3 layers of the model.
Schlumberger soundings and their inversion interpretations depend for their validity on confirmation that the field setting is a layered earth (i.e. varying in one dimension only). A test for more complex conditions is shown here, via two identical soundings positioned over the same site, but conducted perpendicular to each other... one expanding north-south, the other east-west.
In truly uniform 1D conditions, the data and interpreted profiles will be identical. Here, the data differ, and so the computed layered models also differ. The deeper model (400m to 700m) is essentially agreed upon as a conductive horizon at 4-5 ohm-metres. Conditions between 70 and 100 metres reflect the main difference in the raw data observations. A two ohm-m conductive layer between 60 and 110 metres below surface is seen in S-2, but not in S-3, suggesting a linear (2D) feature like an outflow plume. The plume would be oriented along S-2's electrode spread, where it affects the measurements more than in sounding S-3, where only a subtle increase in conductivity is seen as the sounding passes through the conductive feature.
Note that a similar set of effects would occur due to a conductive body positioned at near-surface along S-2's wire layout route, 300 to 500 metres to one side of the centre-point... also a partially non-1D earth setting, but again just at shallow depths. The deeper agreed model can stand, with caveats. The example reinforces the importance of plotting the location of each sounding's field wiring layout on a summary map, so that sources of non-1D effects be considered. The same applies to 3pS data, which are similarly subject to lateral variation error (non-1D conditions).
This may be an area where a full 1D inversion (to AB/2=3000m) would be employed to confirm a geothermally-interesting situation. Several other sites near this one report similar deep conductivities beneath 400 to 500 metres of more resistive material, lending support to the model.
We are not entirely haphazard about this. Experiments were done with fully-populated 1D inversions followed by repeat inversions employing fewer and fewer field data, until just the three at AB/2 = 250m, 500m and 1000m remained. Some minor adjustments to the 1D algorithm controls revealed the best settings for simple 1, 2 or 3 layer model results that consistently provided reasonable correlation with the larger data sets from which the three test sample data had been extracted. That process done, we have maintained the same setup, for the same 1D algorithm, effectively normalizing for all projects those arbitrary elements of bias or trends that originate in the processing algorithm itself.
Keeping in mind these limitations, we can comfortably compare, group, categorize and otherwise work with the computed layered result "suggestions" as plotted beside each data site icon (and its three field data observations). When some area gains specific interest as a result of these layered suggestions, a full Schlumberger sounding may be positioned in order to confirm and detail the vertical layering with a full 15- or 20-point data set.
A single-depth ("1pS") map. The named red anomalies are producing geothermal fields.

These are the stations collected to 1986. The colored contour map employs
additional stations collected in ongoing surveys since 1986.
Statistically, measurements at AB/2=500m avoided contact with the deeper non-geothermal conductor, preserving a very reliable correlation between AB/2=500m conductive zones and in-situ geothermal systems.
This is a cautionary example for those who may strive for "depth" as a first survey objective. Clearly, the application of one-parameter resistivity sampling across any wide area requires careful consideration of what is being (and might be) measured, and how best to interpret the pattern of results to the true benefit of the survey objective.
Bibby et al (2005) is enlightening as much for its application caveats as for its confirmation of the face-value validity of (selected) New Zealand Schlumberger mapping results.
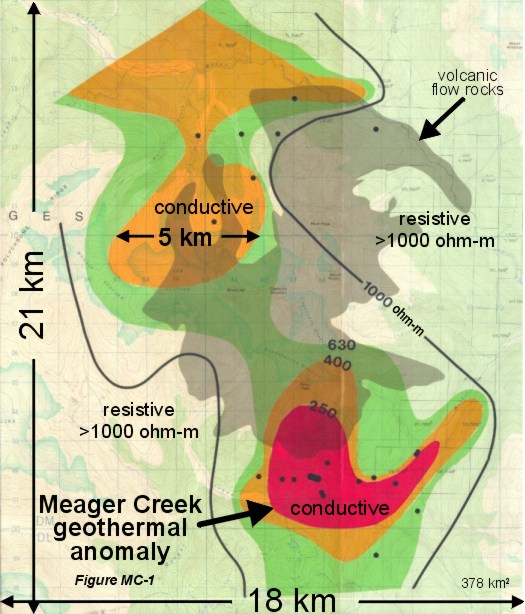
The 250 ohm-metre Meager geothermal system anomaly (in red) was cut off upslope by a number of "3pS" Schlumberger 3-point measurement sites. The lower areas and the outflow plume had already been defined by valley-bottom (and along-slope) dipole-dipole array resistivity traverses.
The black dots are drill holes and test wells.
To the north, a large fossil (cooled down) geothermal system was similarly defined by the high-elevation 3pS mapping. Lower-valley dipole-dipole traversing had mapped an outflow plume and partially tracked it upslope toward the centre of the volcanic complex. On the ground over this fossil system, alteration clays of the "boot-sucking" variety are pervasive, attesting to the former power of the hydrothermal regime below.
Though difficult and often dangerous, the acquisition of the high-elevation 3pS Schlumberger data points proved essential to understanding the patterns and limits of the two geothermal systems at Meager Creek.
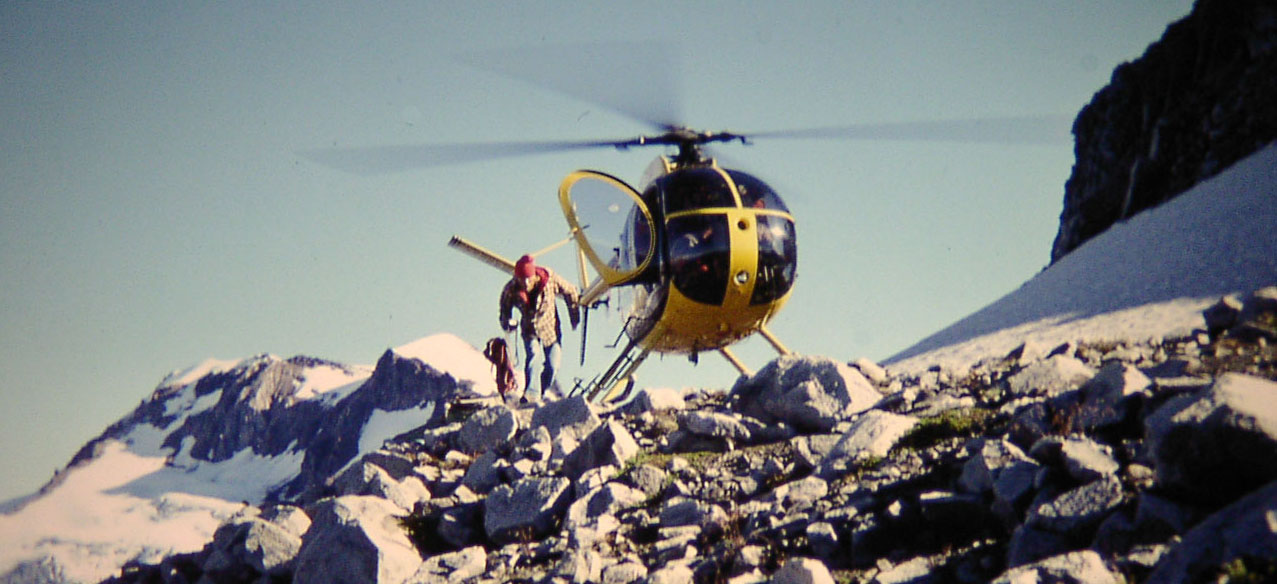 3pS survey crew get dropped off by a Hughes 500 high in the Meager Volcanic Complex
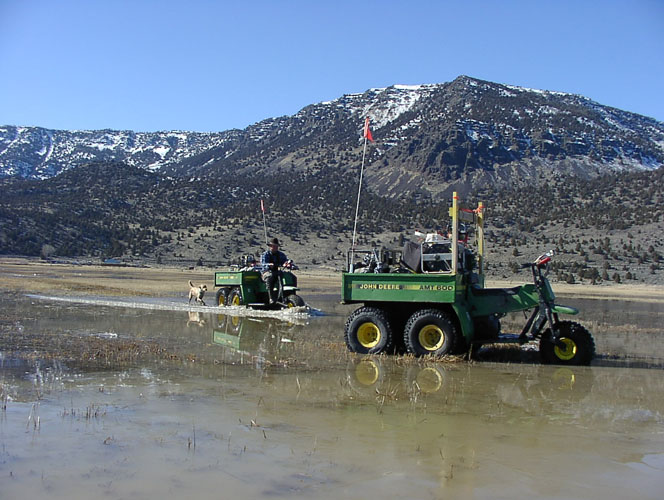
On the truck, lightweight boats... this photo is from a preliminary site visit, en route home from a 3pS survey in flooded conditions in Oregon.
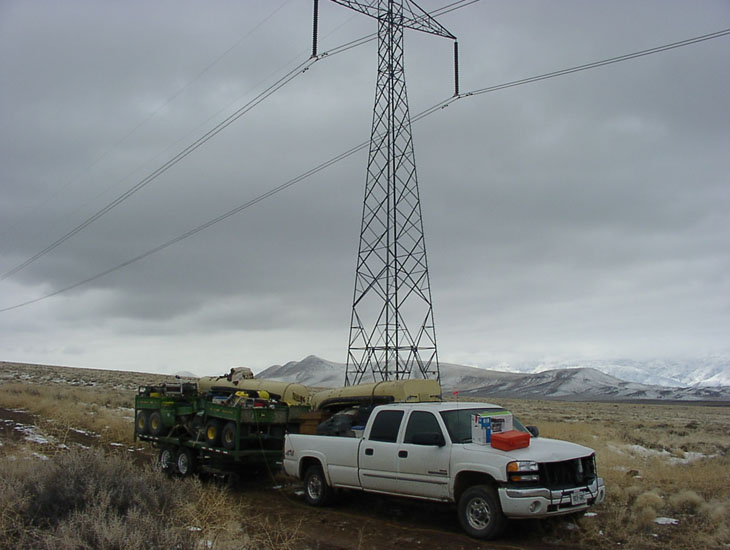
 The 3pS surveys conducted to date in the western US and Canada have contributed considerably to an understanding of how the method should be applied, and
how the results can be interpreted and utilized.
 Parameters have been kept constant to help in building a catalog of signatures and responses for each general category of terrain and geology.
The reconnaissance measurement density in most areas is one site per Km2, with additional sites added as needed to further resolve or confirm the edges of zones of interest.
The 3-point measurements have consistently been Schlumberger arrays of AB/2= 250m, 500m, and 1000m, representing effective depths (Ze) of 95m, 190m, and 380m respectively. Where topographic conditions preclude a full 2000 metre spread, one or more of the AB/2=1000m wires may be shortened to fit, rather than acquire no data at all.
back to top of this page
back to top of this page
back to top of this page
back to top of this page


3D E-SCAN is draped over the Pumpernickel geothermal property.
From the website of Nevada Geothermal Power:"The Pumpernickel property covers 10.34 square miles (26.79 square km). It is located in north-central Nevada, 30 km (20 mi) east of Winnemucca, in Humboldt County. The Pumpernickel site is estimated to contain a 15-33 megawatt net geothermal resource. The project has produced reservoir temperature estimates from 302°F (150°C) to 424°F (218°C). Maximum well temperature recorded has been 275°F (135°C) with temperatures increasing at bottom."
The Pumpernickel geothermal prospect area presents a diversity of thermal manifestations including hot springs, seeps, and alteration. There are thermal and chemical data from numerous investigations undertaken over several decades. In 2005, a 3D E-SCAN resistivity survey of the area was undertaken to obtain large-scale 3D imagery of the entire setting for a first overview of this geothermal system's geo-electric signature. The electrode array approach was unique in its design to provide for high resolution of shallow features associated with hot spring vents, while assuring deep characterization of the larger scale outflow/reservoir system and underlying structure.
The 3D survey results have identified a large, highly conductive anomaly lying beneath the valley floor. The anomaly is positively constrained on all sides by higher resistivity rangefront and adjacent valley signatures. Three dominant sets of structural lineation are observed.
Two of the three dominant groupings of structural orientations are parallel to the western rangefront (NNE) and to the northern (Mt. Edna) rangefront (east-west). A third set of linears oriented north-northwest is rotated 45 degrees west of the main rangefront orientation.
Within the large conductive plume are two extremely low resistivity sub-areas, associated with projected intersections of structure from these three dominant linear groups, suggesting sites of increased rock permeability, along which thermal fluids may more easily rise. A two-orientation conductive pattern occurs in the hills above the area's principal hot spring vents.
An off-grid extension of the main conductive anomaly is seen at the northeast corner of the grid, inviting interpretation as to cause. Being downslope as far as valley floor topography is concerned, this anomaly extension could represent outflow leakage from the main reservoir of thermal fluids. Alternatively, or in addition, the extension may represent another site of hydrothermal fluid upwelling associated with the local intersection of east-west and NNE rangefront fault systems.
The 3D resistivity results provide objective, all-directional structural information and pattern mapping within which ongoing exploration data can be integrated, toward the objective of understanding and exploiting what could possibly be multiple hydrothermal resource sites.
anomalous conductivity up into the mountainside rising to the west of the break in slope.

 Employing a hybrid 200m/400m wiring plan.
 The client's specified area of interest (AOI) is expanded into an oversized survey grid for two reasons:
1. The larger coverage area provides some definition of the "background" geo-electric conditions surrounding the AOI, so that any anomalous patterns within the AOI can be cut off by the resumption of background values.
2. For DC resistivity surveys (including IP), acquiring deep data requires wider spaced electrode sets. The extra two rows of electrodes surrounding the AOI provide over a thousand additional deep all-direction measurements which span the edge of the AOI to provide fully hard-data-constrained 3D model resolution at all depths within the AOI.
Since the measurements originating from this outer area are meant for background and deeper edge-area data only, the 400m station spacing in that area is sufficient.
Within the AOI itself, additional stations were located on a 200m intermediate grid spacing to increase the lateral resolution of the first 500 metres below surface.
Signal from the 200m "current-only" stations is measured at the surrounding 400m grid stations, to a radius of not more than 4 x 400m or 1600m. This provides a high density of "shallow" (150m to 1200m) raw data capable of supporting a the more detailed 3D model mesh size of 50m by 50m. Later, wider shots from each 400m station to the other 400m stations provides a coarser set of high-density, extra-deep all-directional data sampling to depths of over 3500 metres, sufficient to constrain a true 3D earth model to depths in excess of 2000 metres below surface.
The map at right shows the 400m fully-wired E-SCAN grid setup, with 200m spaced current-only stations between. On this fifth day of shooting, the map shows that about half of the limited-radius 200m current-only shots have been made, those sites marked with small solid color circles. 12 of the 400m stations have also been shot (larger two-color circles) in areas where the 200m station shots have already been completed. The data acquisition process will continue down the map until all stations have been shot. After wires are used for a final time (for current or signal measurement), they are picked up either for refurbishment and re-use, or for recycling for copper values.
By the time that data acquisition finished, less than three days was required to complete the removal of the remaining wire and electrodes, restoring the area to the condition in which the crew found it upon arrival.
 Plan view through the 3D model mesh.
 The outer three rows of cells are normally trimmed off before presentation of the remaining 3D model cells as the formal results of the survey. However, just as conditions in this adjacent area influenced measurements made on the actual survey grid, so the 3D algorithm uses the surrounding area for the assignment of values necessary to allow the main-area 3D model to approach the edge of the survey grid in a natural distribution.
Where a conductive mass is shown in the outer three rows of cells in the model results, a similar volume most likely exists beside the survey grid in the real valley setting, having influenced the measurements made immediately adjacent in the survey area. As such, we can cautiously entertain the presence features outside the survey grid, at least in a gross and non-geometric approximation. Something significantly conductive must lie east of the north half of the grid, at "X".
Correspondingly, the three outer rows of cells confirm that no such conductive mass lies anywhere else outside the survey area. Having expanded the survey area two stations (800 metres) outward on all side from the AOI, the formal 3D model results show the main conductive anomaly terminating before reaching the edge of the survey grid. The expanded "working cells" area confirms that this is no mistake or approximation; it is real.
Without the 800m expansion of the survey area, the resolution of the edges of the anomalous body would not have been possible. There would be very limited exploration value in such an open-sided result. As it is, there are no loose ends in this model's imagery. The confirmed presence of a single conductive excursion adds exploration interest: whether this excursion marks a system outflow, a separate adjacent source of upwelling fluids, or something else, remains to be investigated. The survey results have only confirmed an off-grid manifestation of potential exploration significance.

 Summary of linear or structural "picks"
 The linears (and arcs) represent resistivity breaks or edges picked from a large number of plan and section images. These may represent non-structural edges of resistivity zones, structure-related resistivity zoning cutoffs. They can be used collectively to infer structural controls or fabric. The colors should be ignored; they code only for the nominal source of each observation or "pick".
The rose diagram show three principal groupings of inference orientations, two being parallel to the (NNE) Pumpernickel Valley fault (west side range front) and the (E-W) Edna mountain fault across the top edge. A third group crosses the area at a north-northwest angle in significant numbers.
Conductive centers A and B are suggested to be possible subsidence centers (Szybinski and Shore, 2006), whose mechanical (collapse) origins would be consistent also with enhanced permeabilities required for thermal fluid upflow. Even without a physical subsidence, locations of thermal fluid ingress at fault intersections at A and B could be expected to present increased conductivity signatures due to locally increased alteration from the hot fluids.
D is the site of hot springs and the Magma test well, another possible location of thermal fluid delivery to the conductive anomaly.
 A shallower view
 The linears (and arcs) are unchanged from the previous image. The plan view resistivity slice is now 50 to 75 metres below topographic surface, about 100 metres closer to surface.
Anomalous areas E, F and G have components that are parallel to the rangefront faulting, and also to the NNW trend, aligning with C D E F. Being upslope from the hot springs at D, anomalies E, F and G may represent hydrothermal alteration, and are of presently unknown thermal characteristics. The anomaly at H is related to a known hydrothermal mineralization system that is not hot at present, and contained mineable grades of metallic ore.
At this nearer-surface depth of imagery, the conductive anomaly that exits east from the north half of the main conductive anomaly appears disconnected from the main anomaly, unlike deeper imagery.


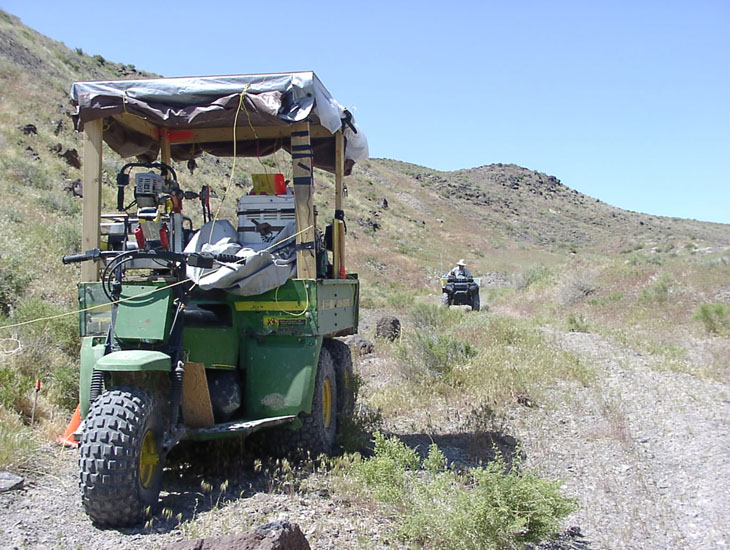
Very low pressure tires help protect soil and vegetation from permanent damage.


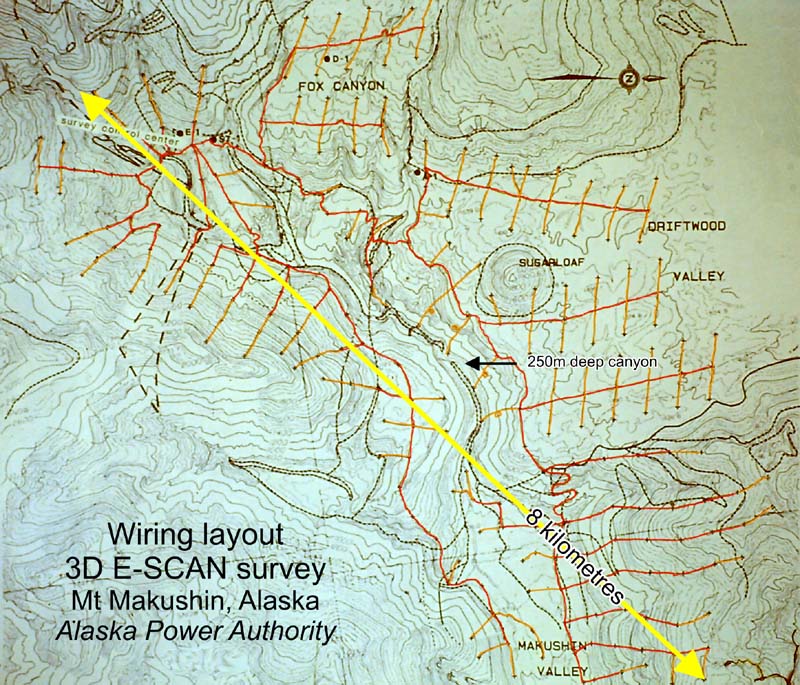
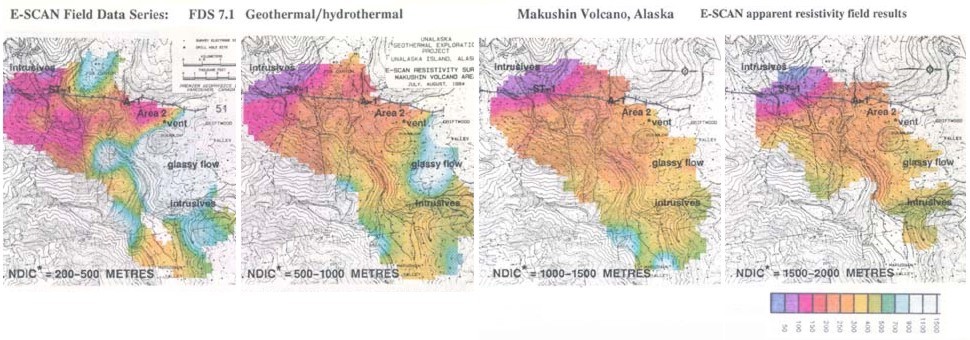
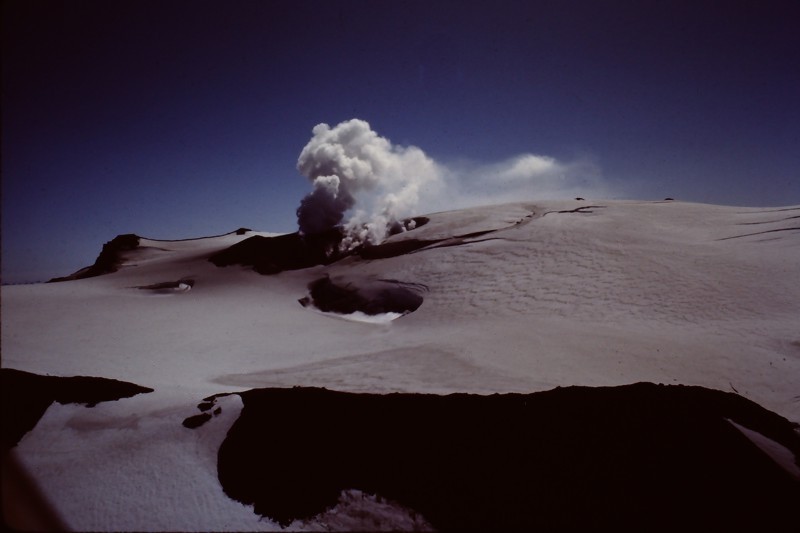
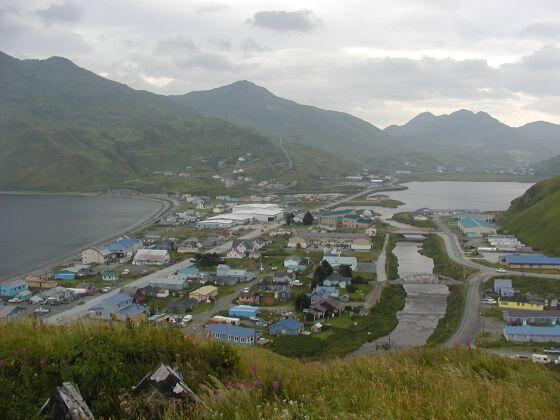
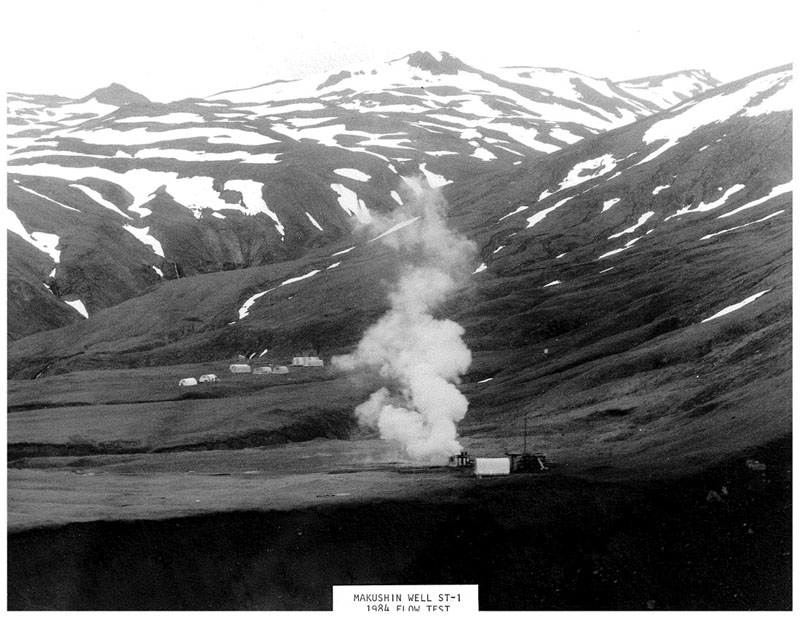
Makushin Volcano, Unalaska Island, the Aleutians.
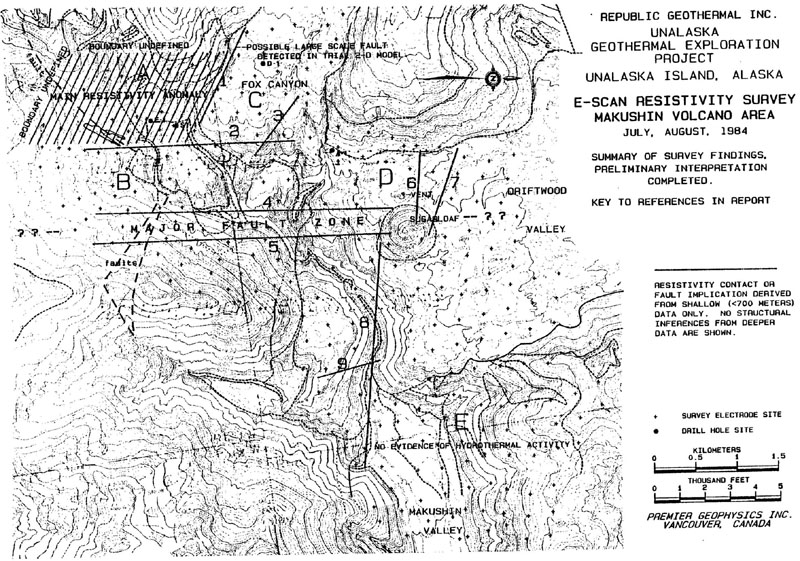
Explorationists had established a test well (ST-1) that indicated about 10 megawatts of sustained production capacity. An old track suitable for road development extended from tidewater to within 2 Km of the producing well site, but then encountered very steep terrain that would require extremely costly bridge and road engineering to get across. Geologists hoped to establish a similar resource opportunity closer to the end of the established road (Area 2), to reduce access costs and speed development. A fumarole in the road-accessible area was measured at over 200 degrees Celsius, but without permeability at depth, there would be no flow, and therefore no exploitable resource.3D E-SCAN was brought in to survey 10 square miles (25 square kilometres) covering all of the areas in question. The survey would establish the geophysical signature of the known-resource setting and then test for equivalent indications in the road-accessible fumarole area. Extending the survey further along the valley toward tidewater would test for additional resource possibilities along the road. In a remarkably efficient 24-day period, the E-SCAN survey crew successfully acquired the high-density, uniformly-distributed, all-directional, extra-deep 3D resistivity data set that was needed to answer these exploration and development questions.
The known-productive area at the far south edge of the survey was characterized by the survey data as being highly conductive from surface to depths exceeding the survey's limits. The conductive zone was sharply cut off to the north, more than a kilometre short of the road accessible area. The conductive anomaly remained open to the south into an area rising upslope on the flank of Makushin Volcano, in the "wrong direction" in terms of establishing resource potential closer to the accessible end-of-road area.
In the prospective fumarole area at the head of the road, shallow conductivity prevailed, equivalent to that of the productive area to the south. However, immediately below this the rocks became resistive, suggesting an absence of permeability. The hoped-for repeat of the productive area's signature was not found here. Subsequent drilling (at A-1) confirmed high temperatures, but tight rocks, incapable of supporting productive flow.
Further down the valley, the 3D survey confirmed the absence of any other areas with a signature equivalent to that of the test well area. The survey demonstrated that exploitation of geothermal energy from the area would indeed require access across the difficult 2 Km area, or via some other route. No more-accessible resource signature was found.
Development of geothermal power would replace both towns' long-standing dependence on imported oil for local power generation.
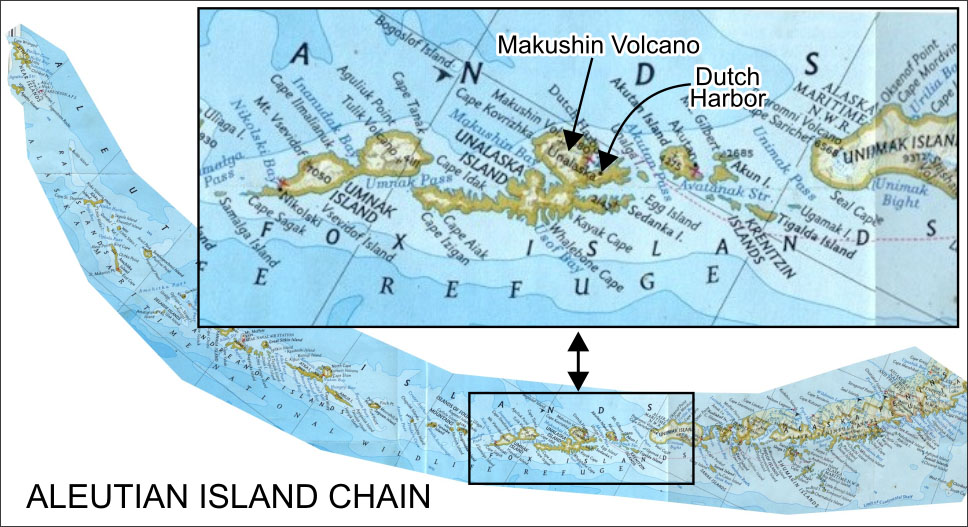
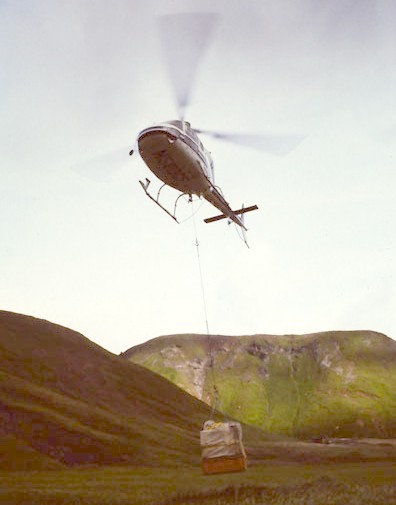
the wire lifted directly from the deck of a coastal freighter anchored in
Dutch Harbor. Seven round trips were required to get everything in.
24 days later, with the survey completed, all of it (including the wire)
had been flown back out again, leaving the landscape clean and undamaged.

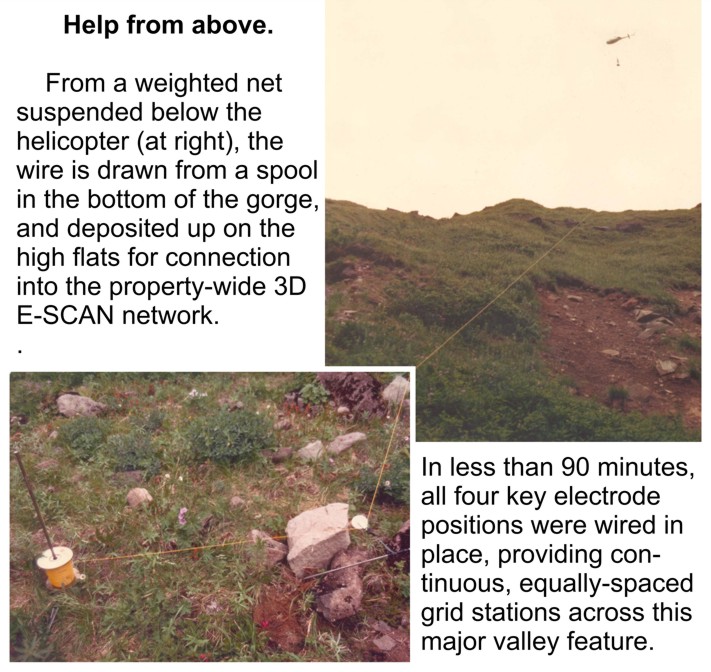
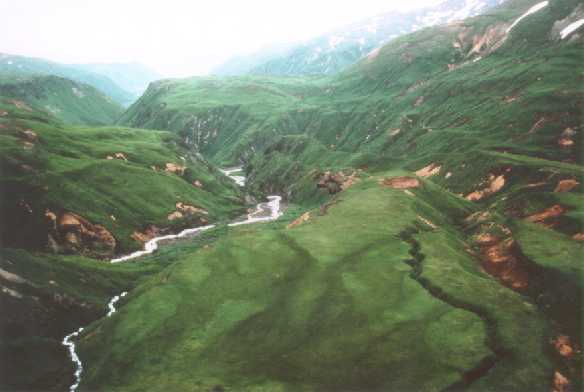
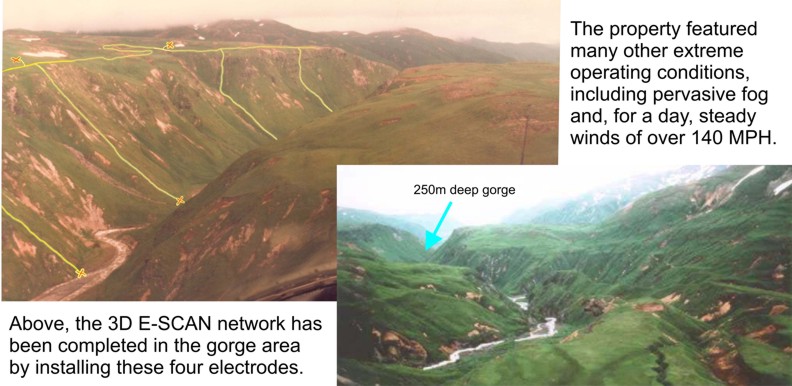
The notch at upper left is the 250 m deep canyon of the Makushin River, where helicopter-assisted wiring secured 4 (of 275) electrode sites.
Grass-covered, oversteepened ash-fall slopes made for slippery working conditions. The frequent steep gullies and dangerous streams are part
of the reason why conventional along-line geophysical surveys could not be effectively deployed. For 3D E-SCAN, this terrain is easily managed.
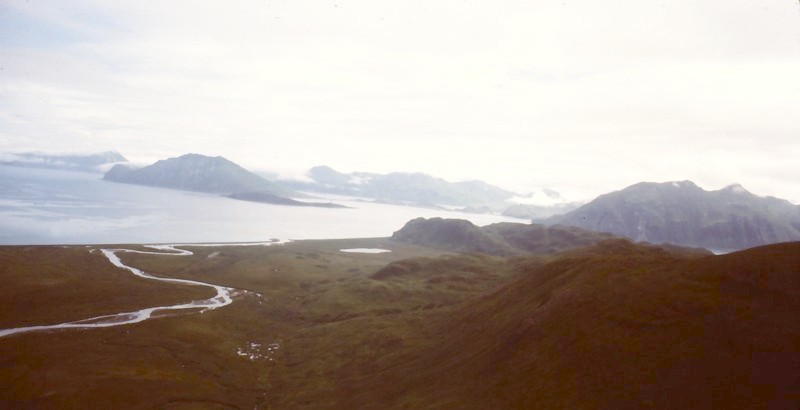
wired back to the survey area for use in the 10 square mile (25 Km2) 3D E-SCAN survey. The potential infinite
circuit was laid down another valley toward the ocean, in the direction of Dutch Harbor (east).
Most gullies hosted white water streams that could not be crossed on foot, requiring an occasional helicopter jump.
To install wire and electrodes on the most treacherous slopes, crews were set out on ridges by helicopter, to lay
wires and electrodes downslope for connection into the main grid wiring system in the lower elevations.


during the 24 days on site. The plot illustrates the uniformity of distribution of the observed data, independent of the often-extreme
topographic conditions in the area. These data are sorted into four nominal depths of investigation (and contoured) in the next image.
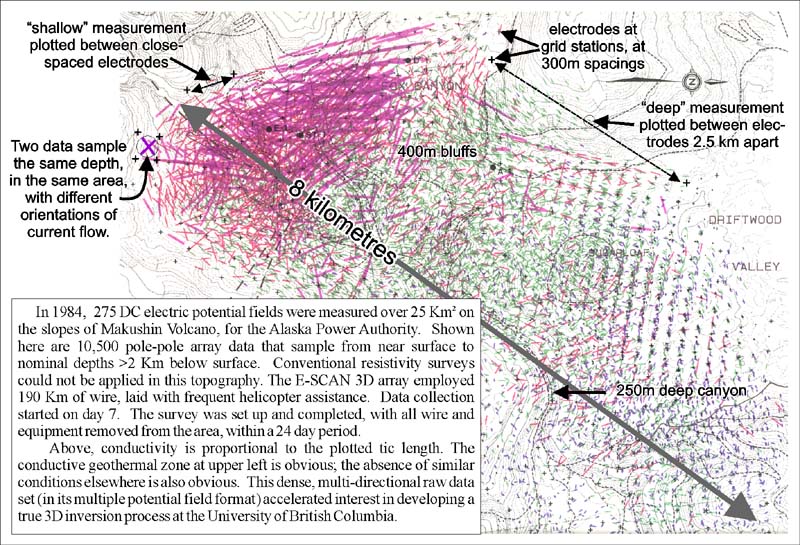
while confirming where such zones are not found. In the shallowest data image, resistive flows cover broad areas. Conductive zones
are seen at left and also in "Area 2", enclosing a 200 deg C fumarole. Deeper down, only the upper-left corner shows conductivity
continuing to depth, an observation supported by later inversion processing. The rest of the areas show none of the deep conductivity
signature that locally indicates both heat and permeability at depth. Drilling in Area 2 confirmed high temperatures in nearly impermeable rocks.

The photo is from the 1984 Final Report available as a PDF download, click PDF at left of page title.
These are the electronic switching boxes that help E-SCAN access so many electrodes with a minimum amount of wire.
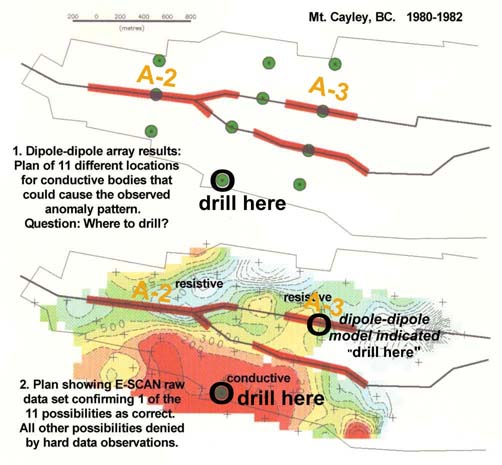
1982: 3D E-SCAN resolves an ambiguous 2D line-data interpretation.
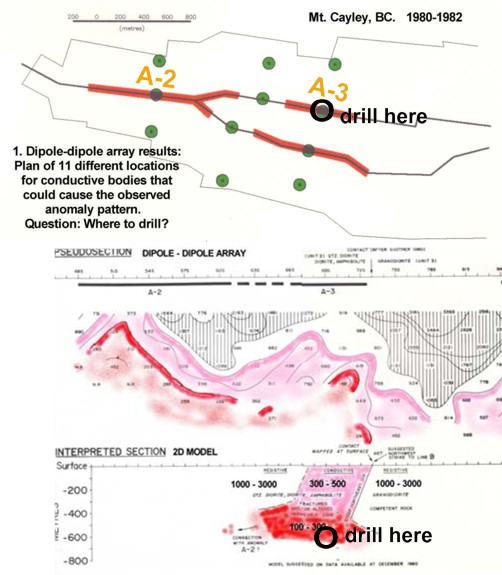
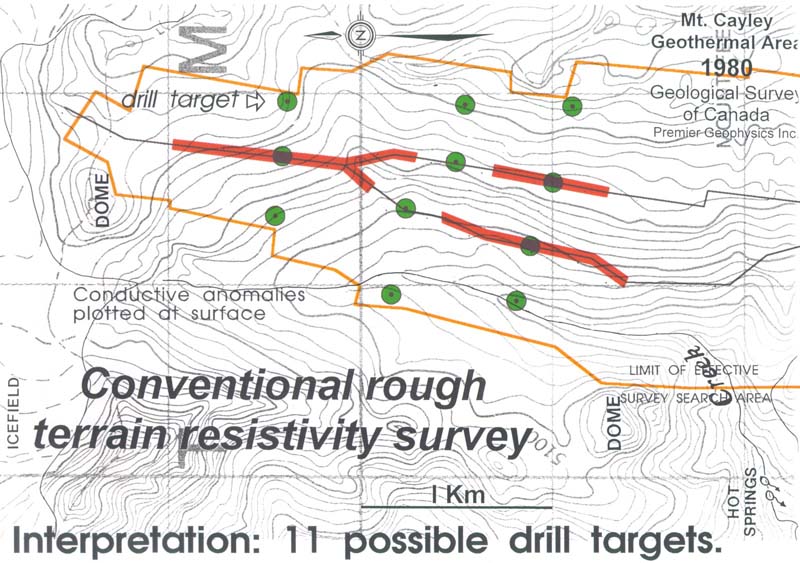
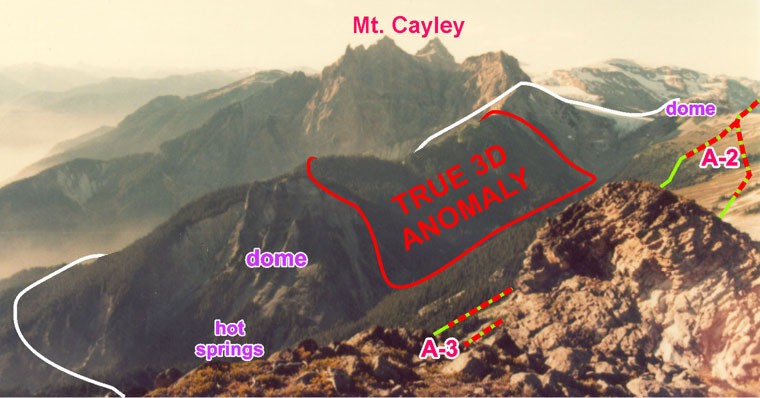
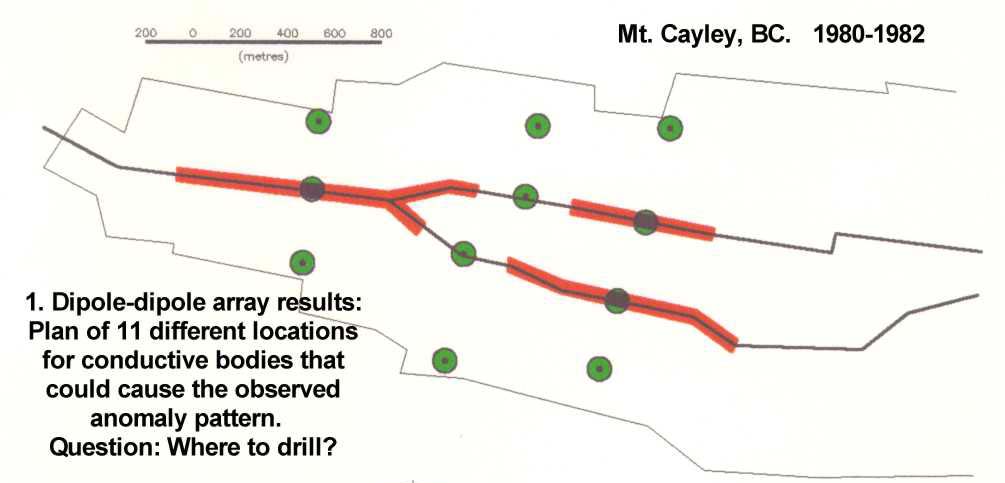
A high-elevation cross-country resistivity traverse across the Mt. Cayley geothermal area detected a strong conductivity anomaly pattern not far from some known hot springs and young dome structures. Despite the extra data acquired by installing a difficult second parallel survey line, the interpretation of the two-part anomaly remained ambiguous. No fewer than 11 different locations were identified as possible sources of the conductive material causing the anomalies.3D E-SCAN clearly established that just one of the 11 candidate areas was responsible for the dipole anomalies. This conductive area lay not beneath but west of both of the dipole traverse lines (but still within the swept volume of each line). Adding certainty to this interpretation was the confirmation, using equally comprehensive field data measurements, that all 10 of the other candidate sites were located in resistive territory.
The 3D E-SCAN system was designed to operate in this type of extreme physical conditions, so that explorationists can always be assured that in every field program, sufficient true 3D field data will be generated to fully resolve any anomalous conditions, without ambiguity or uncertainty.
LINEAR + 3D - updating today's geothermal reconnaissance strategy to state of the art: This case example shows that a reconnaissance geothermal mapping process employing E-SCAN's LINEAR + 3D sequence provides complete, 3D target-resolved reconnaissance mapping that is more certain of a useful result, and more cost-effective, than traditional reconnaissance methods. First, the high speed LINEAR E-SCAN samples a 10-times greater swept volume than a typical dipole-dipole array survey, pushing the effective lateral search radius far into the adjacent rough country (and deeper) to pick up outflow signatures and in-situ resource bodies alike. Then, using the wiring setup already in place for LINEAR E-SCAN, a 3D E-SCAN setup comes efficiently into play by expanding the LINEAR electrode layout laterally into any terrain, to deliver a comprehensive 3D mapping of the precise geometry and characteristics of the sources of anomalies that have been encountered along the planned route.
This sequence condenses the wide-area reconnaissance phase and the follow-up target verification phase into a single highly-efficient survey that will never leave you wondering, for example, which of 11 possible targets you should drill,- regardless of terrain conditions or complexity of target geometry.
Upgrading existing prospects: Historically, there may be hundreds (certainly dozens) of dipole reconnaissance anomaly settings worldwide that remain unresolved and inconclusively tested, as a result of prior unavailability of the any-terrain follow-up method explained above. Just as Mt. Cayley's complex and unverifiable anomaly pattern was resolved by subsequent application of a separate 3D E-SCAN survey, so too may other historical settings be resolved today. Explorers with access to geothermal property records may wish to review the circumstances of each property's demise to see whether a fresh (and accurate) resolution of drill targets associated with dipole traverse anomalies might warrant renewal of exploration investigations in the area.
The same opportunity may exist for abandoned properties where the principal reconnaissance geophysical mapping has been 2- or 3-point Schlumberger array traversing (New Zealand/DSIR style), or some "roving dipole" experiment. These approaches may lack the operational flexibility and the comprehensive true 3D data capabilities that are needed to unambiguously define drill target geometry in difficult terrain.
Crone Geophysics can help in this property review process.
in British Columbia. Hot Springs and favorable geology mark this area as prospective for geothermal energy.
Rugged terrain severely limits the opportunities for resistivity traverse surveys. The field crew pushed a single
dipole-dipole array resistivity traverse through the alpine region, considered theoretically sufficient (by computed
swept volume) to test the Shovelnose Creek valley for anomalous conductivity.
Extreme North Cascades terrain allows only one resistivity reconnaissance traverse.
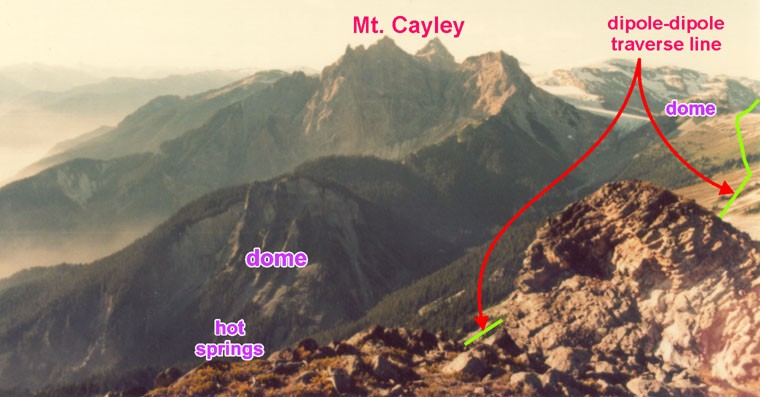
An effective second survey traverse (left-side green line, lower on the slope) was operated for a short distance by running wires
downslope from the higher line stations. Steeply-incised gullies prevented lateral traverse of the mid-slope area. An upper-line
conductive anomaly observation was thus re-sampled along the adjacent lower line, in an effort to provide the field data for a
more accurate interpretation. Client: Geological Survey of Canada. Target: a geothermal reservoir in resistive crystalline rock.
Two dipole-dipole anomalies are identified.
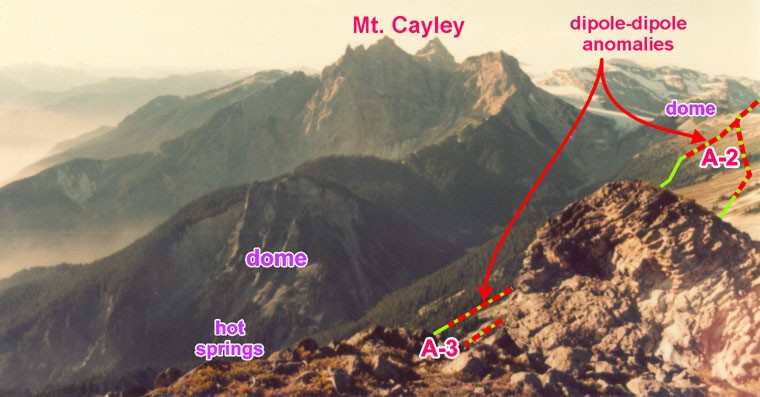
photo, the viewer is located off the upper right corner of this map, looking across to the major edifice under the word "terrain".
The orange envelope enclosing the lines indicates the effective lateral distance that is sampled from the along-line array.
Of course, this same distance-from-line applies to depth below the line as well. (see next image below).
Plotting in this manner recognizes the inherent inability of any single line data set to distinguish the origin of the anomalous
responses within the sampled half-cylinder that encloses the survey line. 11 different, plausible anomaly locations are identified.
This graphic explanation should always accompany pseudosection data, to correctly manage/control dimensional expectations.
Eleven distinct anomaly sources are permitted by the line data.
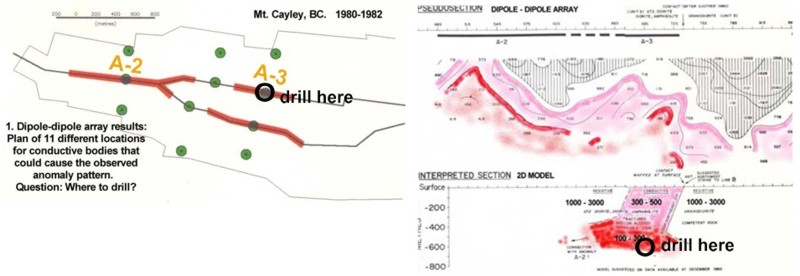
State-of-art (1980) 2D modeling offered a priority (?) initial drill target.
We have been leading up to this example.
The data pseudosection for the main survey line (of the two shown in the previous plan view image) exhibits some anomalous values
at n=4 to n=8. For the 2D forward modeling (lower panel) to proceed, an assumption had to be made that the conductive media lie
below the line. There was and is no support for that assumption. However, perhaps in the absence of anything else that could be
done with single-line data, and on the chance that the anomaly source did indeed lie below the line, a substantial program of 2D
forward modeling was contracted out to the experts of the day.
The 2D earth section met the key criterion that the model's calculated field-data equivalent should closely match the actual field
data observations ... a "good fit to the data" ... meaning that such a model could exist, given the field data set in hand.
It is at this point that the importance of the earlier guessed or assumed requirement for a 2D earth setting is often forgotten.
Was the drill hole well-targeted? Did the deep anomaly exist where the 2D model predicted?
No drilling was done on this model. 3D E-SCAN, born and developed in the Meager mountain volcanic complex not far to the north,
was almost ready for its field debut. Theoretically, true 3D mapping could resolve, unambiguously, which of the 11 possible anomaly
locations represented the right drill target.
Cayley, the Geological Survey of Canada brought in 3D E-SCAN.
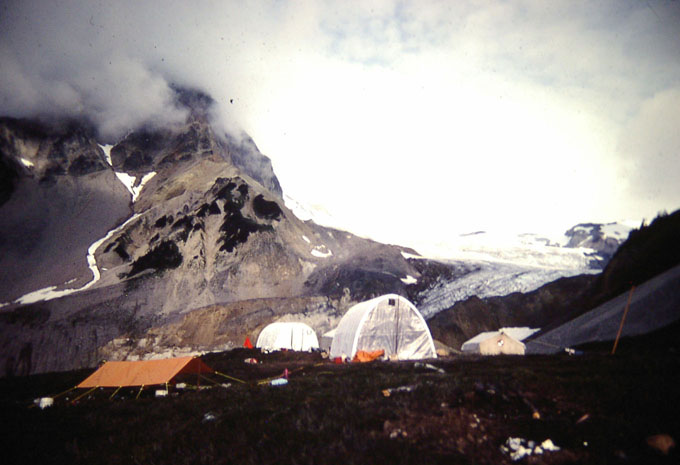
First task - establish a base camp on the property.
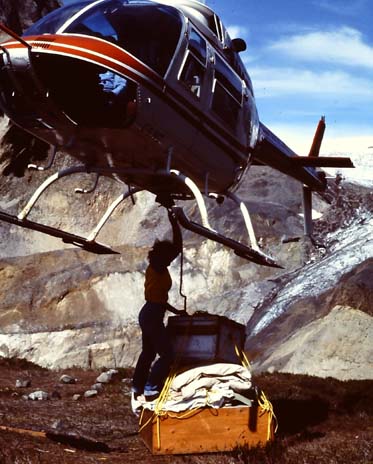
Everything had to be brought in by helicopter.
An opportunity for the new (1982) 3D
E-SCAN technology to clarify the targeting?

The Geological Survey of Canada pays for the test.
With no line-type restrictions, the 3D E-SCAN system layout was able to cover the area of interest, providing a dense,
multi-directional, extra-deep field data set that would support evaluation of the true 3D nature of the property's subsurface.
Even from the raw data, it became immediately apparent that the dipole-dipole anomalies were reactions to a single, strongly
conductive anomalous zone located to one side of both dipole line routes. All other areas were shown to host non-anomalous
higher resistivities. Of the 11 possible sources of anomalous material, just one was involved, and it was not the location
suggested by the 2D modeling results. The 3D E-SCAN data showed that the regime underlying the \dipole=dipole lines was not 2D,
and therefore the 2D model results based on that disproved assumption were invalid.
Ten anomalies positively eliminated, one confirmed... and not the one we thought.

The search envelope of the dipole-dipole traverse lines had sampled the conductivities lying adjacent to the west, serving the initial purpose
of identifying areas of interest in general. With true 3D follow-up, the location and true geometry of the buried conductive body was under-
stood, while at the same time, the non-anomalous areas were confirmed as such by the equally dense hard-data sampling that spanned the property.
The true single source for the compound dipole-dipole anomaly is nowhere near the survey lines.
The concept of initial detection of anomalous conditions by traverse geophysics was enhanced by replacing the shallow, limited-envelope
performance of the dipole-dipole array with E-SCAN's deeper, wider-sweeping pole-pole array. LINEAR E-SCAN would cost-effectively sweep along
valley-bottoms and rugged areas alike, detecting anomalous conductivity that may indicate geothermal reservoir conditions or outflow plumes.
Unlike the predecessor dipole methods, LINEAR E-SCAN could be instantly expanded in the field to provide real-time true 3D characterization of
any anomaly, resolving unambiguously the location and geometry of the anomalous feature during the course of the initial reconnaissance survey.
Instead of more questions, LINEAR E-SCAN's result would be a fully 3D-resolved anomaly, ready for next-stage testing, with no need for further
electrical geophysical surveys.
Stunned by the magnitude of conventional-survey misdirection,
new (3D-amenable) line traverse technology quickly evolves.
The concept of initial detection of anomalous conditions by traverse geophysics was enhanced by replacing the shallow, limited-envelope
performance of the dipole-dipole array with E-SCAN's deeper, wider-sweeping pole-pole array. LINEAR E-SCAN would cost-effectively sweep along
valley-bottoms and rugged areas alike, detecting anomalous conductivity that may indicate geothermal reservoir conditions or outflow plumes.
Unlike the predecessor dipole methods, LINEAR E-SCAN could be instantly expanded in the field to provide real-time true 3D characterization of
any anomaly, resolving unambiguously the location and geometry of the anomalous feature during the course of the initial reconnaissance survey.
Instead of more questions, LINEAR E-SCAN's result would be a fully 3D-resolved anomaly, ready for next-stage testing, with no need for further
electrical geophysical surveys.
Utilize the entire 3D scope of line-data sampling, with pole-pole's non-compound response characteristics.

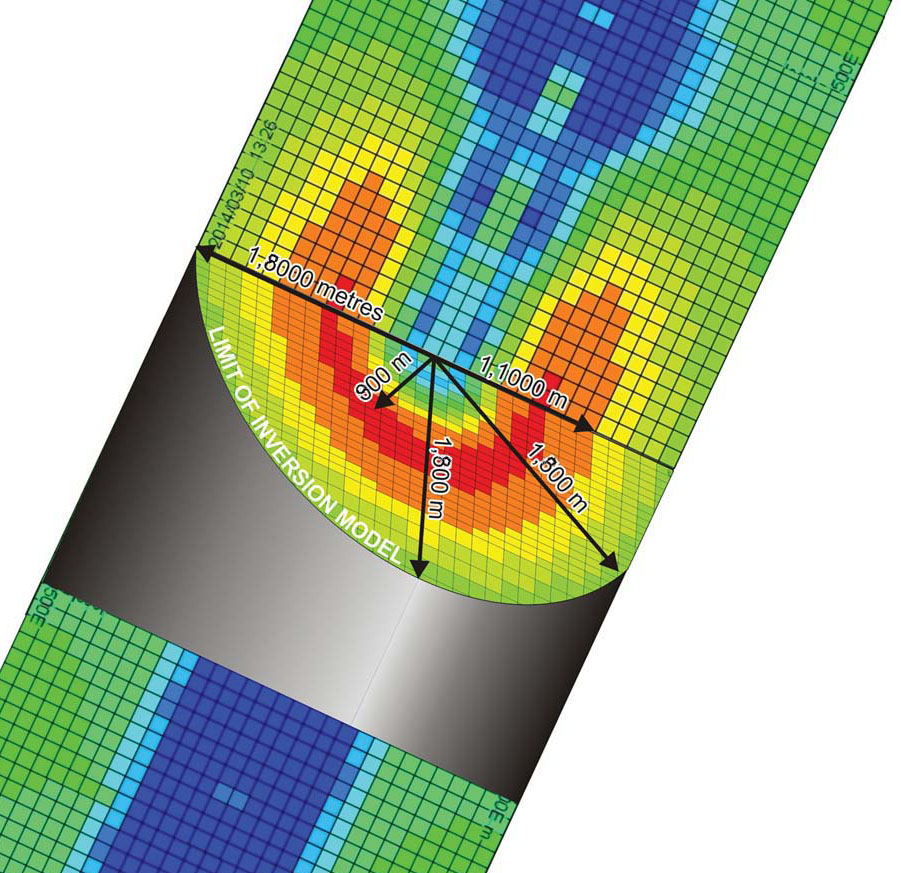
This is a 3D inversion of a single traverse line of data, with a single anomalous conductive response occurring at about half-way through the
measurement array's "n" expansion, say, n = 4 to 5 of 9 "n" array expansions along the line. Pole-pole, pole-dipole, dipole-dipole - all the same.
That single line of collinear data is fed to a 3D inversion, because in fact we have collected this "line" of measurement data over a 3D earth.
In inverting these data, the algorithm correctly assumes that the injected current (and resulting observed voltages) is flowing throughout the 3D
space, and not just below the line. The inversion shows that the observed n = 4 to 5 anomaly response could have originated from conductive
materials not just below the line, but from a radius that is equal to the classic Nominal Depth of Investigation Characteristic (NDIC) or
Effective Depth (Ze) as calculated for the array geometry that is involved. Clearly, NDIC and Ze could be replaced by a term such as "Effective
Radius" or (Re), as a constant reminder to be wary of the section-like conventional graphical representations of line data (i.e. pseudosections).
As for that "key to understanding", this 3D inversion image serves to finally inform us what we know AND what we don't know about the measured
data set at hand. We know that along the line, there are reliable start and end points for the anomaly location, the simplest being delivered by
line data observations. And we now can "see" that the anomalous material may lie anywhere within the radial expression in the image, - below the
line, adjacent to the line on either side, in multiple locations within the imaged arc, or even in all parts of the imaged arc. We now know that
we don't know which location, or how many locations, but at least now we can set out to acquire the clarifying field data to pin down (constrain
with hard data) the one or more verifiable location(s). This may seem trivial, but in the context of historical geothermal exploration (decades of
relying upon similar reconnaissance resistivity line data), there are profound implications in terms of re-=assessing geothermal prospects which may
have been abandoned after similarly misguided drill targeting that was based on this false perception of what the line data mean (and don't mean).
3D inversion confirms the "full disclosure" replacement for the traditional line data pseudosection plot.

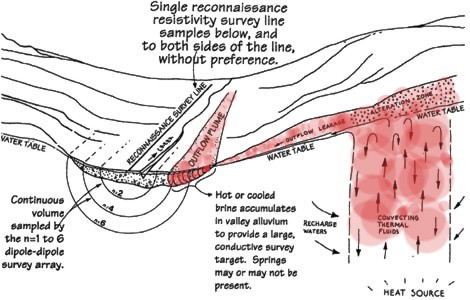
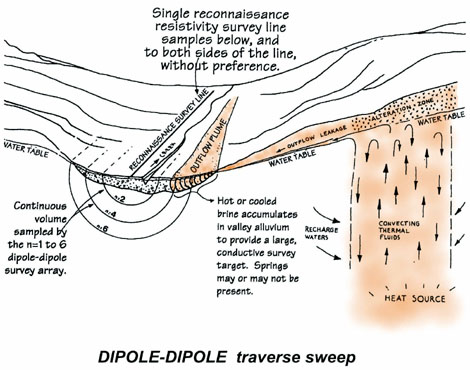
The "swept volume", also known as the "search envelope", refers to the volume of earth effectively sampled by a collinear-array resistivity survey method operated along a single survey line, in this example a single-line dipole-dipole traverse. The primary purpose of the concept is the illustration (and necessary constant reminder) of the total absence of lateral positioning information associated with most along-line measured data anomalies. This improved imagery provokes consideration of all plausible interpretations, for which appropriate evaluation procedures can then be designed. The need for this argument arises from the historical propagation of a misunderstanding of the limitations that are inherent in field data sets originating from single-line DC resistivity (and IP) survey data.
.
The anomalous earth conditions that cause a survey-observed anomaly may lie anywhere within the swept volume, including in multiple locations simultaneously. Historically, the default rule-of-thumb interpretation has us preferentially looking "below the line", even though that fallacy may be warned of in nearby text.
.
In this example, the source conditions for a dipole-dipole anomaly noted at a "search radius" (formerly "nominal depth") equivalent to n=4 to n=6 can be located anywhere within the half-annular volume between the indicated n=4 and n=6 radii. The example's actual anomaly source location is shallow, and located off to the right, as you can see in this section cutaway. Drilling in the traditional default location, below the line, would encounter no anomalous conditions.
.
Move your cursor over the image to display LINEAR E-SCAN's swept volume along the same valley route. E-SCAN's pole-pole array samples a greatly increased swept volume, and will react to the in-situ resource higher on the slope. To the survey crew, however, there is only a strong n=7 to n-12 single line conductive anomaly - no clue as to where the anomaly actually lies. From which side of the valley does this response originate? Or is it from deep below? As with any single line anomaly, it will take more field data, obtained from both sides of the line, to unambiguously determine the anomaly's location.
.
Now LINEAR E-SCAN's en route evaluation mode comes into play... rapid expansion of the single-line LINEAR E-SCAN traverse into a full 3D E-SCAN mapping of both sides of the valley, covering all of the anomaly's multiple possible locations, while the field crew and equipment are already there. This cost-effective and immediate follow-up will clarify and confirm the actual anomaly location. A verified anomaly location means that temperature and chemistry characterization of the possible resource can start without further delay.
 Move your cursor on and off the image above.
 .
Above: The common assumption of a "below the line" anomaly location is arbitrary... the anomalies caused by the conductive areas in the examples above appear "deep" on a conventional pseudosection plot, but the cause of the anomaly could lie anywhere within the swept volume. Array type makes no difference in this respect.
.
Deeper and wider sampling (LINEAR E-SCAN) still doesn't resolve anomaly location ambiguity - follow-up is still needed. "Follow-up" means getting hard data measurements right across the swept area, on both sides of the traverse line, to isolate the cause of the anomaly. The question in rough terrain has always been,- how?
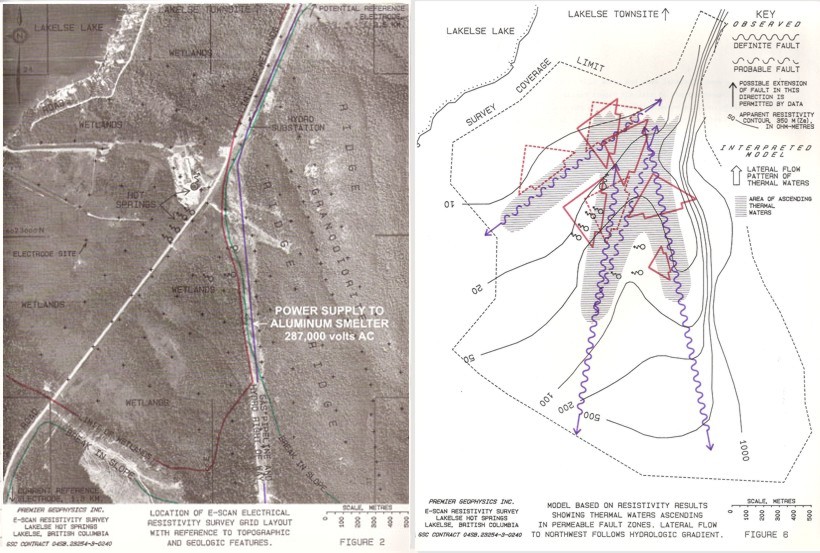
A fault system lies partially under the route of the 287 kV 60 Hz (675 megawatts) power transmission corridor supplying an aluminum smelter at Kitimat, BC. The conductive swamps and clay layers underlying the transmission lines carry substantial induced voltages that are capable of overwhelming some electrical geophysical methods. The 3D E-SCAN survey technology effectively rejects 100% of all signal, allowing uncompromised, verifiable 3D mapping of the several underlying fault structures from which thermal waters appear to be flowing. Note that this is British Columbia
LINEAR E-SCAN begins by taking a far bigger sample of its en-route environment than dipole-dipole or any other array.
This broad swept area extends up steep valley slopes and deep into adjacent mountains and valley areas, to
ensure that any anomalous conditions of possible geothermal significance are reflected in its traverse data.
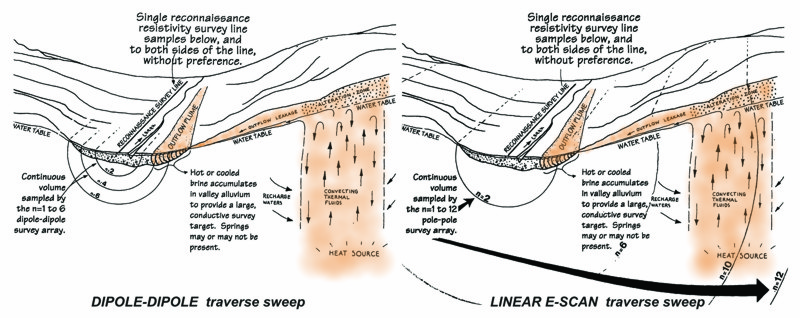
Once detected, any anomaly can then be accurately located in true 3D by expanding the LINEAR E-SCAN survey traverse
into A FULL 3D E-SCAN survey, centered on the anomaly of interest. Additional electrodes are extended to both sides
of the traverse line to provide the dense, all-directional, evenly-distributed, extra-deep field data measurement set
that is required for any objective 3D earth imagery. The result is accurate geometrical definition of any and all
anomalous bodies, beside and/or below the traverse line, ready for further investigation including drilling.
All other parts of the 3D-defined area are characterized with similarly comprehensive hard-data-based imagery, so that
outflow plumes are discriminated from deep- or fracture-seated potential resources, and resistive background areas are
equally reliably mapped.
In preparation. To be continued:
- explain LINEAR E-SCAN at n=12 full sweep still higher signal than dipole-dipole limited sweep at n=6
- illustrate mechanics of expansion from LINEAR to full 3D in a case-based example.
- examples of single-line deployment strategy and rationale
- cost and effectiveness assessment
- how 3D E-SCAN adapts to steep terrain settings to deliver its final 3D imagery
- why dipole arrays can't fit across the valley, -graphics
- single-line at Meager Creek
- single line at Mt. Cayley
- extracted single-line simulation (Makushin Volcano E-SCAN data)
- extracted single-line simulation (Pumpernickel Valley E-SCAN data)
 strategy notes in preparation
POTENTIAL ISSUES: Proximity to seawater. Populated area.
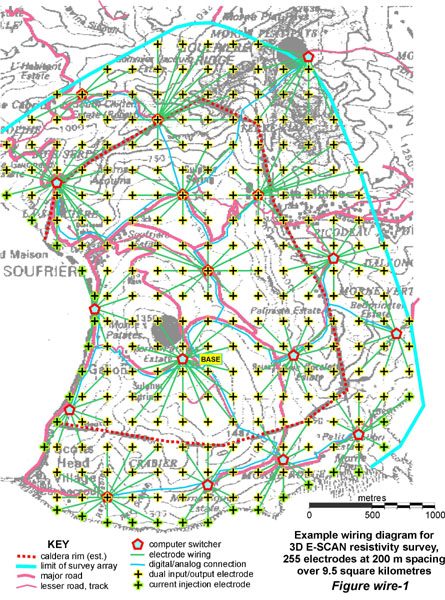
In the southwest corner of the island of Dominica, a caldera is suspected of hosting a geothermal energy resource. The proximity of the sea renders most EM methods unsuitable (uninterpretable) for area mapping. 3D E-SCAN maps the conductive seawater as just another geological unit within the larger 3D earth resistivity model, leaving open the opportunity to accurately map the characteristics of the caldera area map and to determine drill targets within.
This image shows how 3D E-SCAN would be deployed in this populated part of the island. The least-possible amount of wire is achieved by using multiple nodes of 16 to 25 electrodes each, a mode that is anticipated to reduce issues of human and domestic animal interference with survey progress and equipment integrity. Wire connecting the nodes would be strung in tree branches, out of reach of people.
No 3D survey has yet taken place in this area. This is an example only, showing how such a survey could be laid out and operated to produce a fully-effective, true 3D, deep earth resistivity model in a populated area near seawater.
 strategy notes in preparation
POTENTIAL ISSUES: Proximity to seawater.
This part of the island of Grenada is dominated by a volcanic cone, covered with dense vegetation. The proximity of the sea renders most EM methods unsuitable (uninterpretable) for a significant distance inland from the coast. 3D E-SCAN maps the conductive seawater as just another geological unit within the larger 3D earth resistivity model. Continuous 3D mapping inland from the coast allows accurate mapping of the electrical characteristics within the volcanic edifice, and may provide discrimination (by detailed pattern) between conductive structures most likely related to thermal resource waters and those representing salt water intrusion from the coast into permeable structure areas.
This image shows how 3D E-SCAN would be deployed in this part of the island.
No 3D survey has yet taken place in this area. This is an example only, showing how such a survey could be laid out and operated to produce a fully-effective, true 3D, deep earth resistivity model in this setting near salt water.
This will describe LINEAR E-SCAN traversing around the lower flanks of volcanic edifices, using available roads and trails, with the occasional en-route expansion into a full 3D anomaly characterization mode. The operating mode is not substantially different from that applied in North and Central American volcanic areas.
This will describe LINEAR E-SCAN traversing around the lower flanks of volcanic edifices, using available roads and trails, with the occasional en-route expansion into a full 3D anomaly characterization mode. The operating mode is not substantially different from that applied in Japan and in some younger (Indonesian, Philippine) volcanic areas.
The Basin and Range area of the western USA has comparatively few terrain obstructions for any type of geophysical survey. The emphasis is on LINEAR E-SCAN's cost-effectiveness and extremely wide swept volume as it encircles outcropping hills and mountains in search of blind geothermal systems along trangefronts and beneath valley cover.
