IP in True 3D.
This section is UNDER DEVELOPMENT, and will contain case materials from 3D E-SCAN IP surveys, with in-depth discussion.
NEW 3D IP RESULTS: You will find recent 3D IP results from the first True 3D mapping of a part of the Comstock Trend, Nevada,
by clicking on GOLD (above) and then clicking on Example 8. This case material will be expanded in future in this (IP) space.
In the meantime, enjoy the preliminary information provided below... it may answer some questions you have about 3D E-SCAN IP.
For more information on 3D IP, call Nick or Greg at Crone Geophysics (Click on Contacts on the HOME PAGE.)
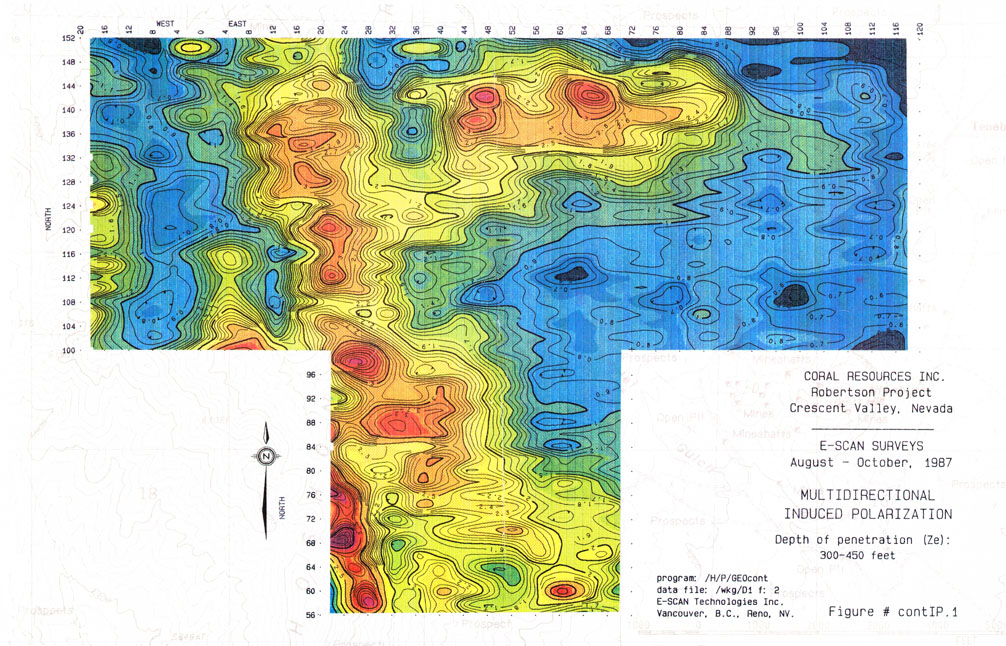
3D E-SCAN multi-directional IP raw data measurements, part of an fs3D IP field data set, 1987.
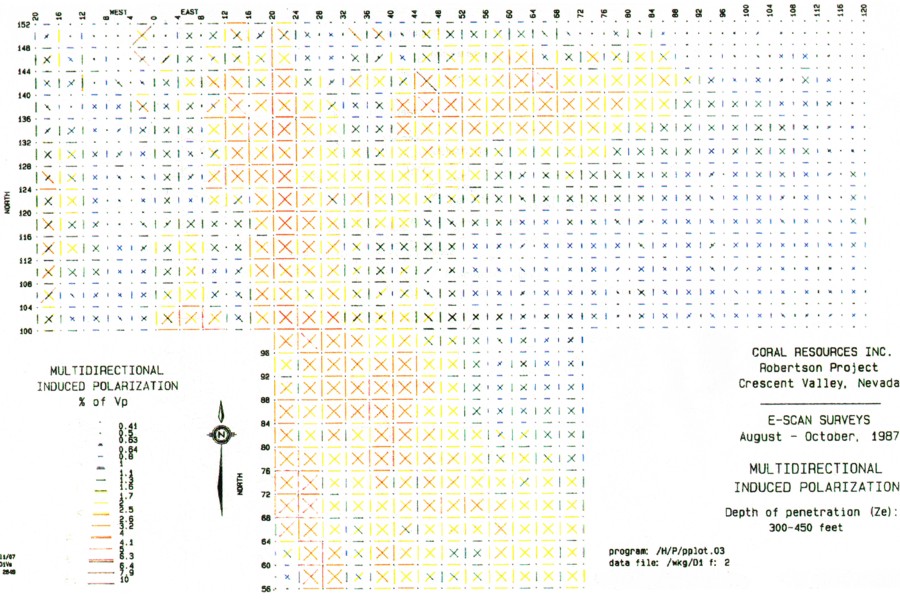
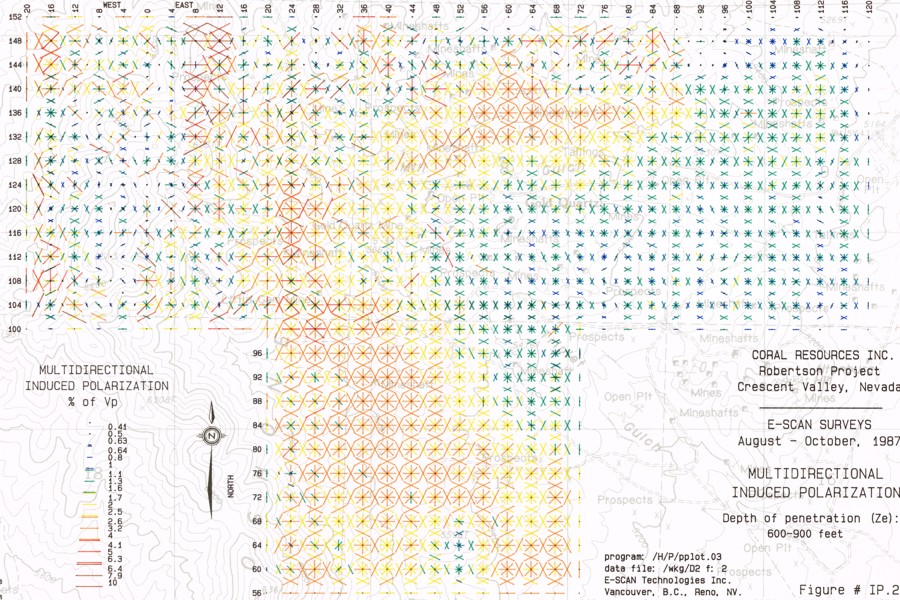
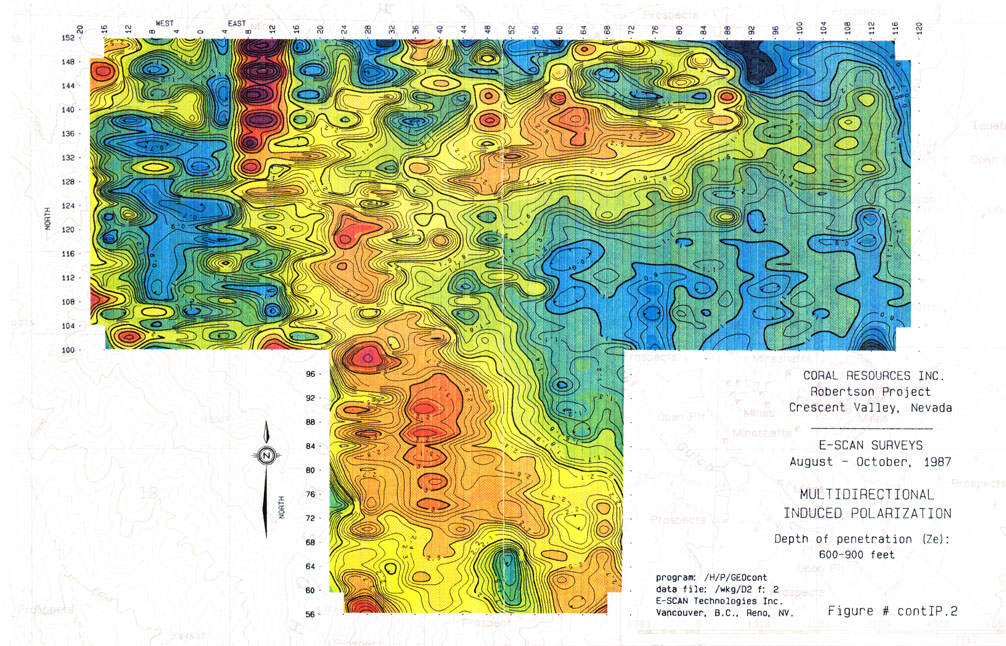
Two field data "vector plots" show IP measurements at increasing nominal depths of investigation, 300 to 450 feet
in the upper plot, and 600-900 feet in the lower plot. Each plotted tic is positioned between its two electrodes, C1 and P1.
The grid station spacing is 400 by 400 feet; the survey area is approximately 2 miles tall by almost 3 miles wide.
Over 4800 pole-pole IP measurements cover the 4 square miles of survey area at the 600-900 foot depth interval alone.
The greater than 20,000 field data set comprises 645 complete, closely-sampled potential fields from 645 different current injection sites.
This IP survey was shot with stainless steel current electrodes, and 645 porous copper-sulfate non-polarizing measurement electrodes.
Note the subtle resolution, the directional repeatability, the absence of any patterned evidence of inductive coupling.
High IP values map an arc of sulfides (up to 7%) partially
encircling a low-IP granodiorite stock (Altenburg Hill) at right.
See Altenburg Hill on the geology map located further down the page.
The arc is part of an annular alteration and mineralization pattern,
within which significant gold was deposited on the inside (low-IP)
edge of the strong and wide pyrite-based IP anomaly pattern.
At upper right, the shallow plot's IP zone appears to terminate at 88E.
Deeper data below demonstrate that the anomalous IP zone continues
eastward to 114E, having been downfaulted by a rangefront fault.
Beyond 114E, there are insufficient data for any further speculation.
These plots illustrate the IP portion of an fs3D (Full Spectrum 3D) field data set, ready for 3D inversion.
Note the date of 3D data acquisition... 1987
Below, simple contouring of the above vector plots highlights the downfaulted IP zone at far right. The plots also highlight
patterns of false anisotropy caused by larger spacings over narrow conductors,
e.g. at 8-12E, 128-152N, in Fig contIP.2
No data filtering is necessary,- 3D inversion automatically interprets these unsettling patterns correctly as a single
strongly-conductive N-S linear, in constructing its 3D earth model. (3D model not shown here).
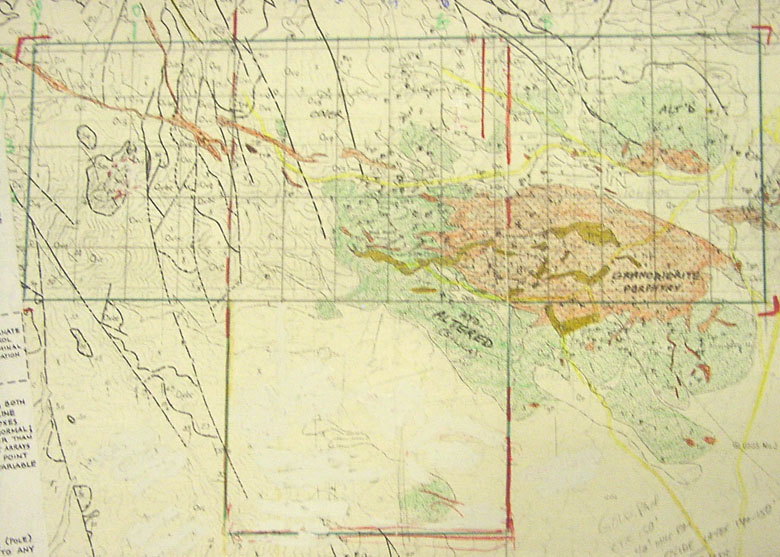
Below, a rough geology map (Armbrustmacher and Wrecke) positions the outcropping granodiorite (Altenburg Hill)
in relation to the outline of 3D E-SCAN survey coverage. Note the mapped alteration immediately surrounding
the intrusion, comprised mostly of silicification with very low (initial) levels of sulfides. Significant gold
values are found within this alteration zone. At a greater radius outward from the intrusion, the pyrite-driven IP
anomaly strengthens across a width of 1600 to 2000 feet, and then finally falls off to background in the distance.
Strong N-S IP linears at 12E to 24E are related, at least in the north, to a narrow band of sooty carbonaceous rocks.
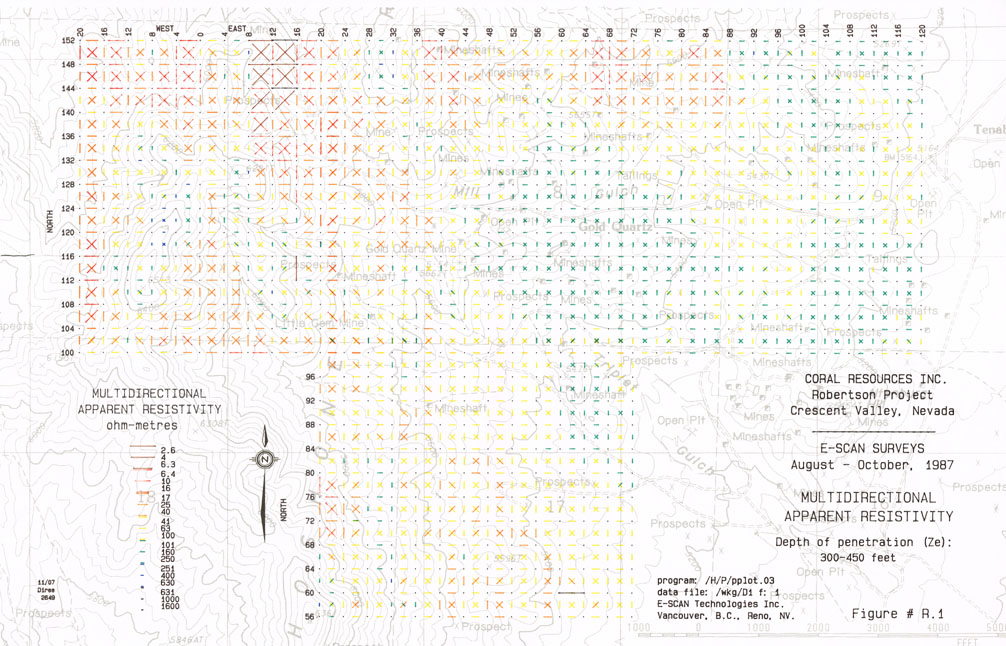
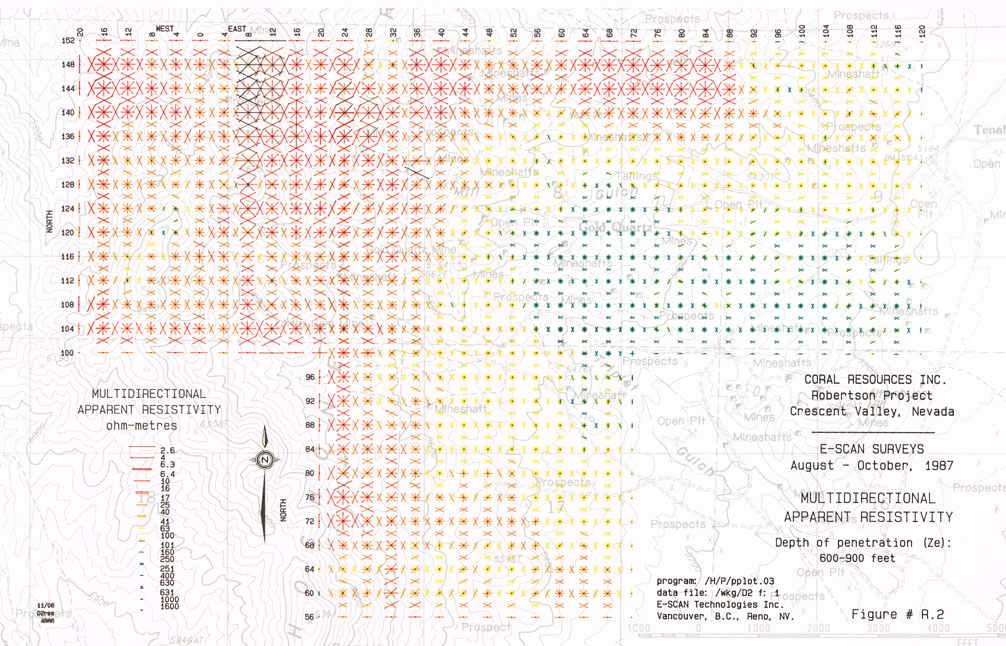
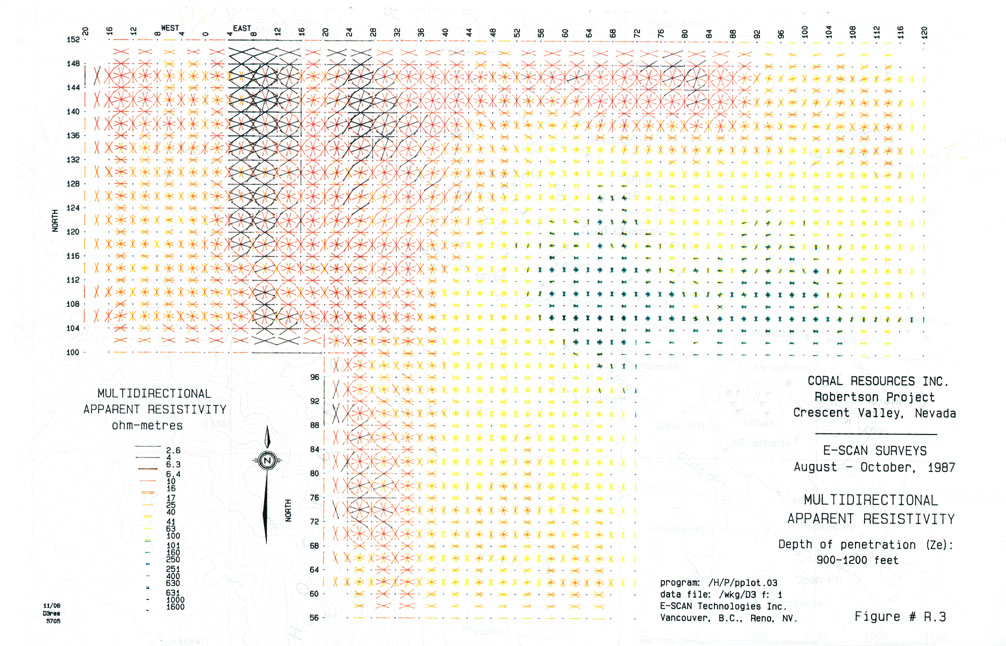
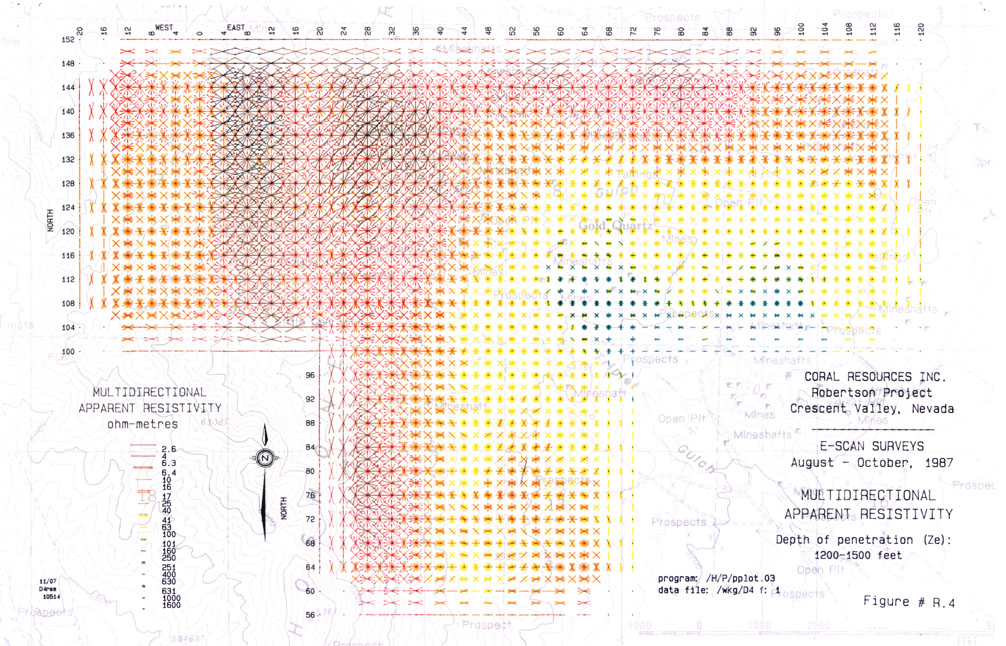
Below, the apparent resistivity field data set that corresponds with the above IP field data.
Note the large resistive mass at right-lower (Altenburg Hill) that marks the granitic stock,
which is the source of the heat and fluids that altered the surrounding volcanics, driving
the deposition of silica, gold and up to 7% sulfides in annular rings across a greater than 4 mile diameter zone.
Even without 3D inversion processing, these unprocessed field data clearly resolved a long-standing
question as to whether the outcropping granitic unit at Altenburg Hill represented a rafted-in slab
or a stock, the latter seemingly precluded by the absence of the aeromagnetic low signature that typically
marks an intrusive stock. The resistivity data clearly indicate a deep-rooted stock, not a slab.
This section is UNDER DEVELOPMENT, and will contain case materials from 3D E-SCAN IP surveys, with in-depth discussion.
Induced Polarization (IP) is a historically important geophysical tool for exploration mapping
of base metal sulfides, particularly in their disseminated form. IP has many other uses, as well.
3D IP has been used in epithermal/mesothermal gold environments in Nevada. In a 3D E-SCAN survey conducted just
north of the Pipeline deposit, the IP component of the 3D survey identified a chargeable annulus surrounding an intrusive
stock, the drill-confirmed sulfides located there being related to gold mineralization in a recognizable depositional pattern.
This survey was key to confirming a rooted, in-situ stock as opposed to a rafted-in slab of granitic material, answering a
key exploration question. Some unprocessed field-data imagery is provided above.
3D IP results from the Hasbrouck Peak epithermal gold survey (see section on Gold) identified a modest IP background
response in the surrounding volcanic rocks, while the silicified gold-bearing zones exhibited almost zero IP effect.
This zero-IP signature is consistent with the known silica-encapsulation of the sulfide grains. Note that in this case, having
the full IP coverage provided no additional information beyond what was already clearly imaged by resistivity patterns alone.
When not directly targeting a sulfide response, 3D IP can provide other characterizations of the rocks that may be helpful in
further discriminating the subtle differences between barren geo-electric features and economic zones. Certain patterns are key indicators
of a hydrothermal history - IP is another pattern-mapping tool, reacting to alteration clays as a mappable aspect. The density and uniformity
of sampling of E-SCAN's 3D IP also makes it possible to identify large-scale anisotropy in the measured data set, another potential
pattern for discrimination of sulfide ore settings (e.g. specific fracture-orientation deposition) from other background chargeabilities.
Three notes:
1. The possible effects of long potential wires on E-SCAN's IP signal quality have been examined in detail.
In terms of susceptibility to inductive coupling, it is the long-wire current infinite and current delivery wire
(in common with all pole-dipole array IP surveys) that is the source of any inductive signal, and this is effectively
managed in all competently-done pole-dipole surveys. The potential infinite employed by E-SCAN is not affected and
itself produces no inductive effect. 3D E-SCAN has extensive real-time waveform monitoring and analysis tools,
including those for inductive coupling identification, mitigation and avoidance, just as any smart pole-dipole
or dipole-dipole IP system should. Inductive coupling has not been identified as an issue beyond what
is expected and observed in any conventional high-power pole-dipole array IP survey.
The large-separation (up to 10's of Km) dipole, comprised of the measurement electrode wire and the potential infinite
circuit, is a different source of concern: indeed, tellurics are occasionally seen over a range of more than 3 volts.
However, this large, low frequency signal is routinely accommodated by E-SCAN's telluric tracking strategy, and presents at
worst a minor slowdown in the field data acquisition rate during those occasional times when the signal management software calls
for additional stacking as part of routine telluric control. These functions are available for review by clients and consultants.
2. With Time Domain IP signal resolution needing to be more than 100 times greater than that of DC resistivity alone, having sufficient
signal is critical. As explained elsewhere in this website, 3D E-SCAN's 100 times advantage in signal level (over dipole-dipole array,
same depth, same current level) make the method a viable tool in areas where conventional IP survey arrays would be shut out. Other 3D IP
systems (e.g. all distributed acquisition or data logger systems) measure derivative dipole data only, relegating themselves (by their
intentional instrument system design) to battling through the derivative data set's combination of low signal levels and poor depth penetration.
3. Synchronization of the receiver with transmitted current is done in 3D E-SCAN using optical coupling with the actual observed
transmitted waveform, for perfect correlation. No radio link, no GPS synchronization issues. 3D E-SCAN's simultaneous and identical
digitization of both the transmitted waveform and the received waveform ensures IP accuracy even in conditions of difficult contact
where current delivery may be ragged,- for example partially delivered by arc into a poor or drying contact. Passive electrode contact
monitoring ensures that signal attenuation is controlled, warning of high contact resistance so that corrective action can be applied,
without disturbing the sensitive electrode-earth interface (as happens with conventional ohm-meter contact testing). These several
aspects make 3D IP second to none in technical competence, even in the difficult conditions in which 3D E-SCAN often finds itself.