HiRes3D E-SCAN and
DATA-LOGGER 3D
The new 3D geo-electric
earth mapping technologies:
What they do. How they compare.
The emergence of "distributed acquisition" or "untethered" 3D DC IP/resistivity survey techniques has explorationists
asking for more basic facts, for a working explanation of what is involved in these new 3D "data logger" surveys.
True 3D DC resistivity surveying and technology is simple in concept.
By providing comprehensive all-directional true 3D field data for objective 3D
inversion processing, the risks associated with the assumptions and subjective
guidance that are demanded by all less-than-3D methods are mostly eliminated.
Here is some background information, and a comparison of current true 3D methods.
Be sure to mouse-over the highlighted
words for extra detail and references.
.
Field survey data sets:
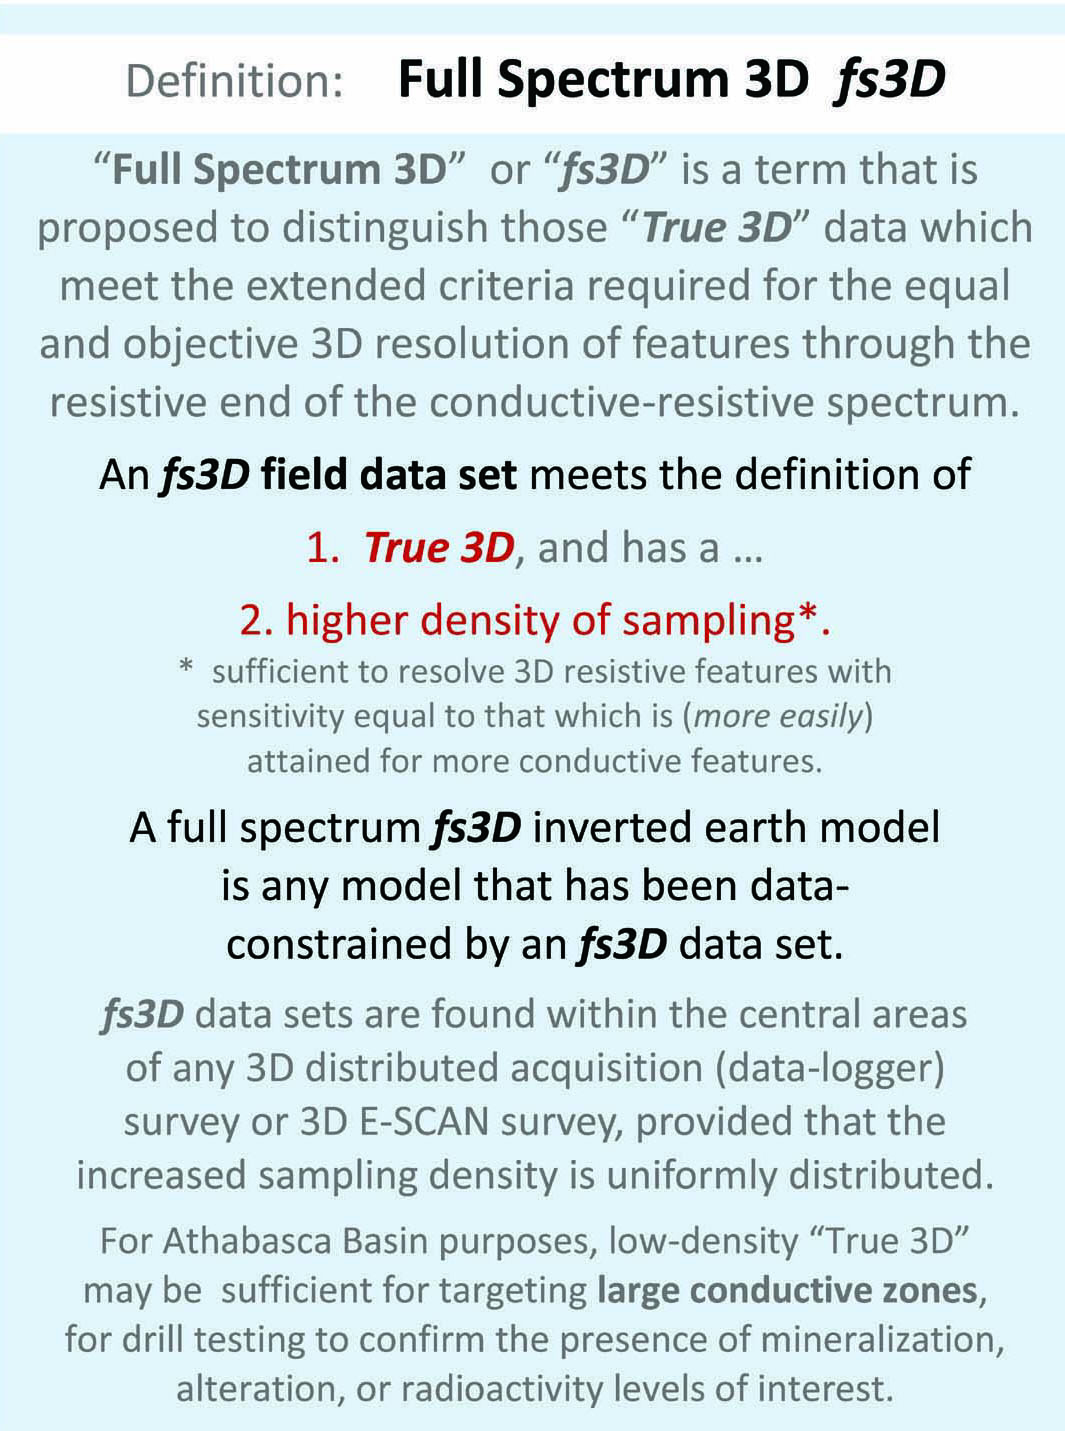
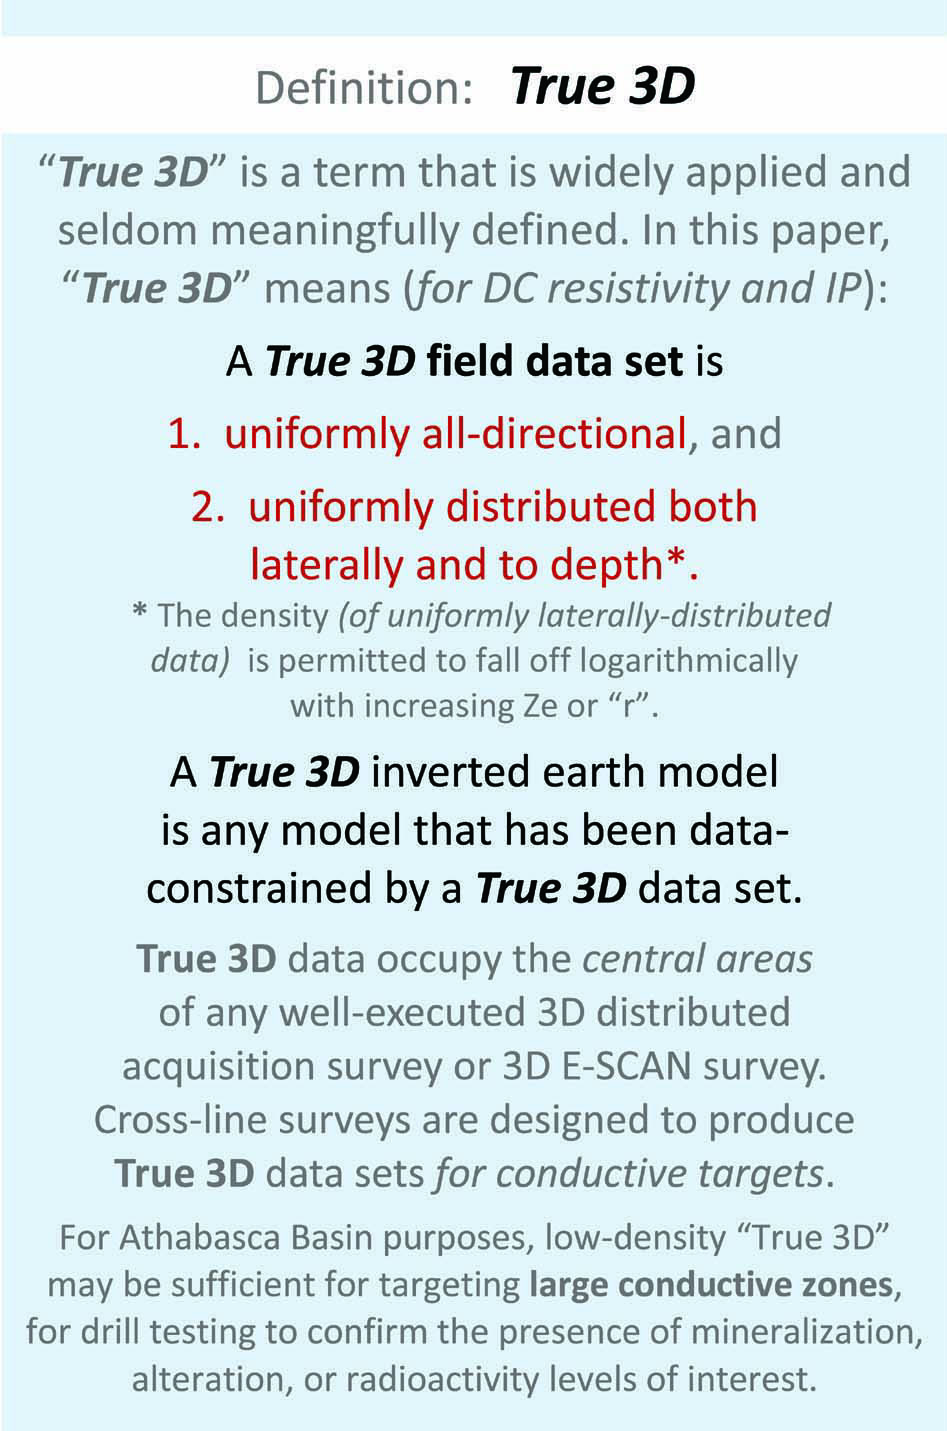
Defining True 3D and Full Spectrum 3D (fs3D)
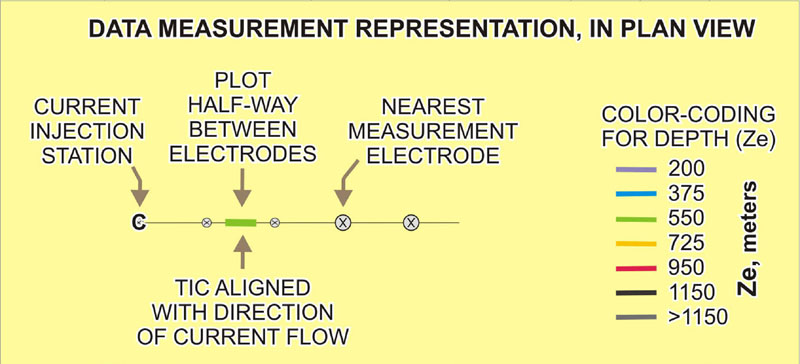
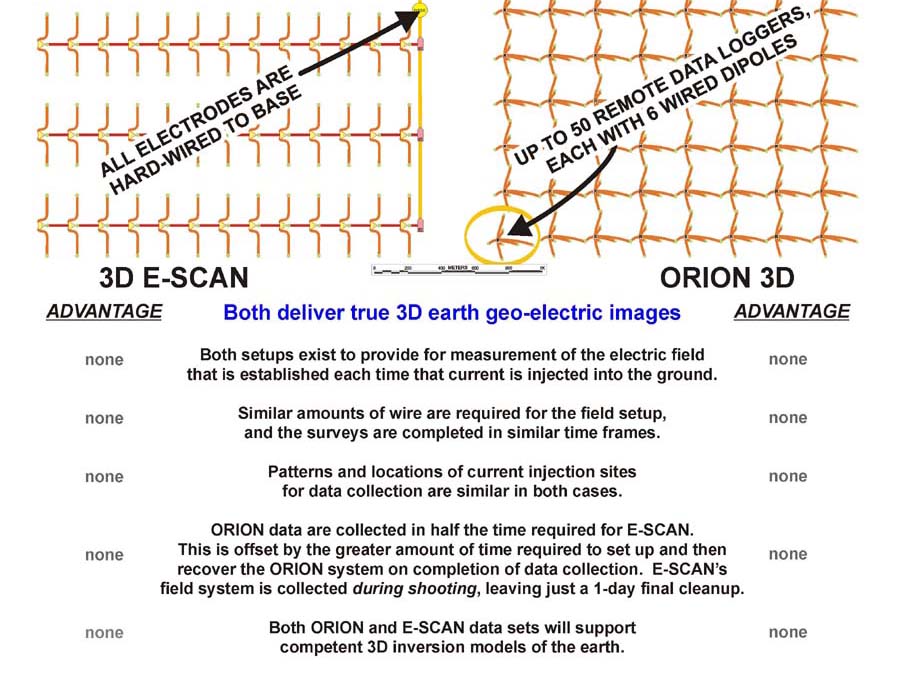
All DCIP survey systems employ direct electrical current injection into the earth,
resulting in the creation of a pattern of measurable signal at surface. For example, a pole-dipole array DCIP survey uses electrodes arranged
along a line, measuring the voltage between electrode dipoles located a progressively greater distance
from the current injection electrode.
The electric field established from each current injection site extends over a large surrounding area, in all directions, not just down the line where the conventional in-line survey measurements are made.
A true 3D mapping system employs measurement stations distributed throughout the studied area, using hundreds of electrodes at once. For each instance of current injection, the entire area of available signal is now comprehensively measured, and not just sampled in a strip of 7 to 10 dipoles down a line.
When repeated for each of the several hundred different current injection sites, this broad-area data gathering accumulates the dense, uniformly distributed, all-directional field data set that is required for a 3D inversion to deliver an earth model of high resolution and best-possible objectivity.
We suggest a working definition for True 3D, and an extended definition for Full Spectrum 3D or fs3D.
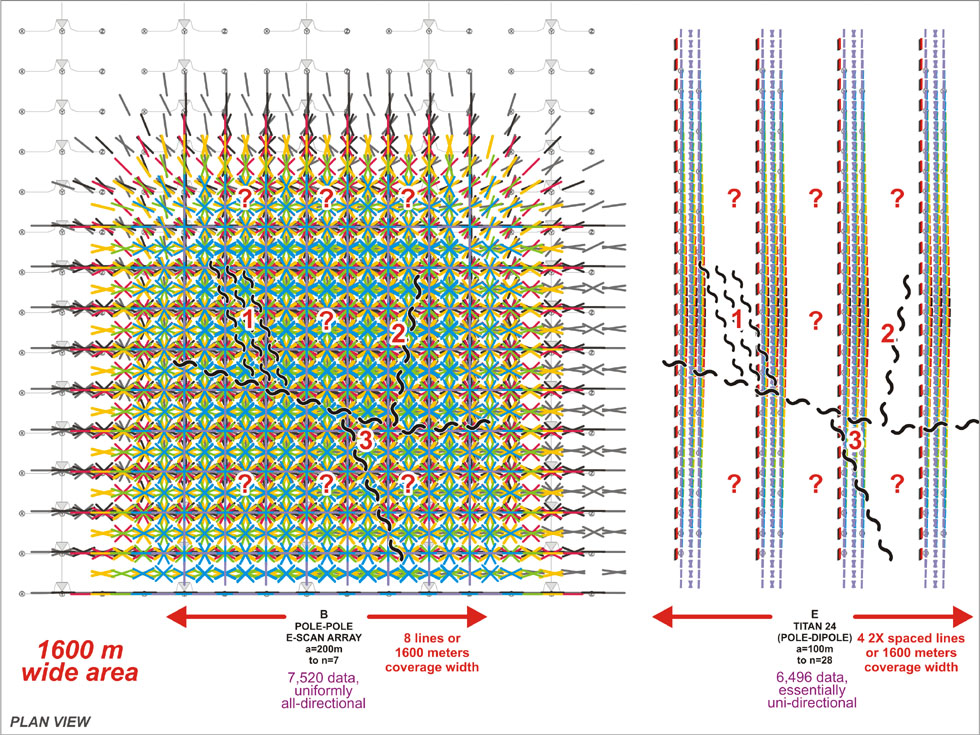
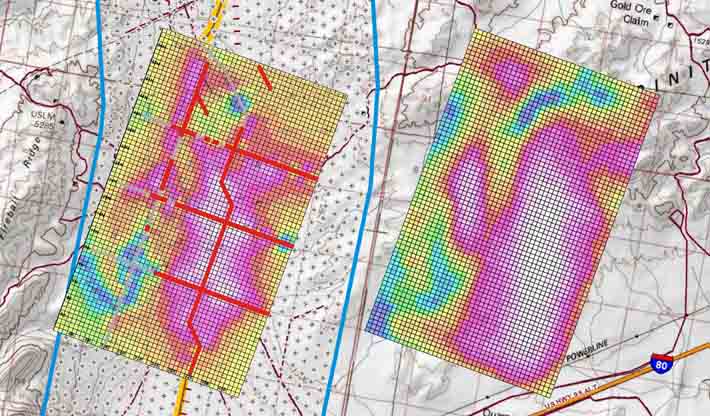
In the figure, a typical non-3D line-based survey comprised of a series of N-S survey lines (right) is deliberately oriented to maximize effective imaging of a known or suspected E-W structure. Cross-breaking structures (unexpected, but which may turn out to be important mineralization controls) would not be well-sampled by this orientation of survey lines. The resulting incomplete field data set guides an inverted 3D earth model which, while delivering a technical "good fit" to the supplied field data, shows at best a distorted indication of possible cross-breaking features. At left, 3D E-SCAN's data tics present dense, all-directional, and uniformly distributed data sampling, supporting an objective 3D inversion model that resolves all features, of all orientations, equally well.
While TITAN-24 data are essentially uni-directional (figure, right), ORION 3D (data logger) data will be uniformly all-directional, supporting E-SCAN-equivalent resolution and fs3D objectivity in 3D inversion model results. The similarities and differences between 3D E-SCAN and 3D data logger survey methods, costs, and limitations are reviewed in the sequence of figures that follows.
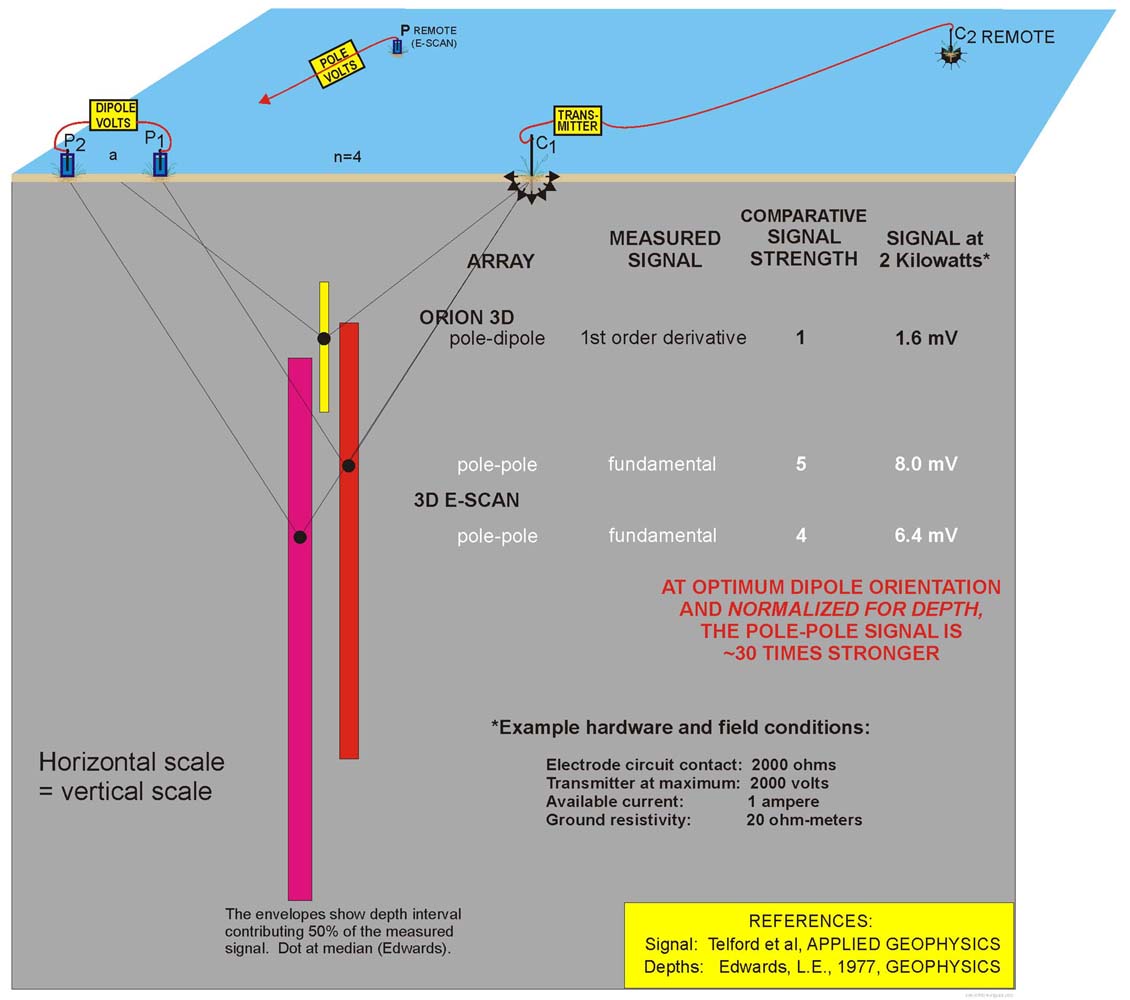
HOW ORION 3D MEASURES DATA:
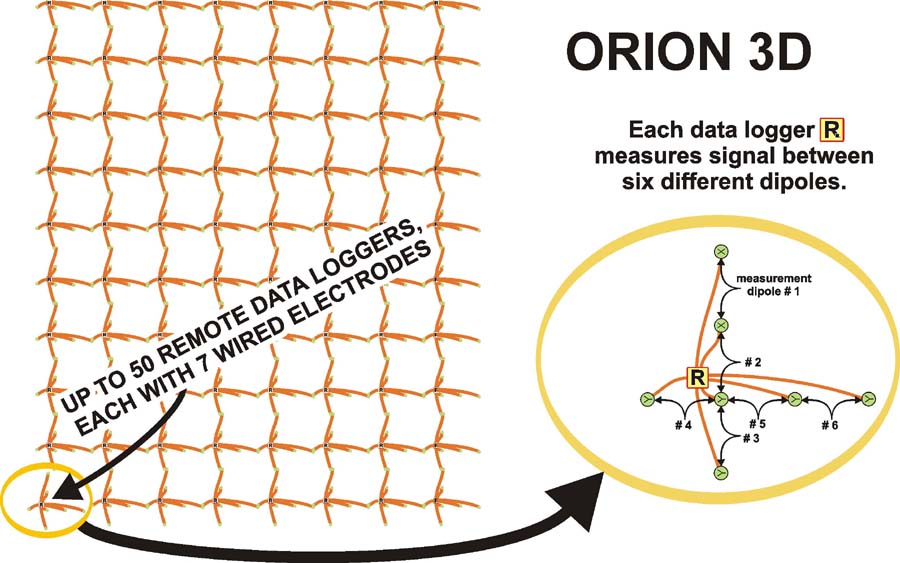
ORION 3D can be thought of as a 3D version of the TITAN 24 method. ORION 3D provides TITAN's two separate survey components,
DC IP/resistivity (for shallow data sampling) and Magnetotellurics (MT, for the deeper half of the survey).
The 3D field technique differs from TITAN 24 mostly in the details of the field electrode wiring arrangement.
Where TITAN-24 uses cabling to connect electrodes to a central measurement unit, ORION 3D uses up to 50 individual
self-contained data loggers, positioned at intervals across the survey area.
Each data logger measures signal across up to six nearby wired-up measurement dipoles, for a total pre-installed
measurement capability of up to 300 dipoles.
Once current injection starts, the measurements are essentially the same as with TITAN 24 (pole-dipole
DCIP/resistivity, plus deeper MT resistivity), the difference being that these measurements are now
distributed across the entire area of interest, rather than along parallel lines (TITAN 24 setup).
HOW 3D E-SCAN MEASURES DATA:
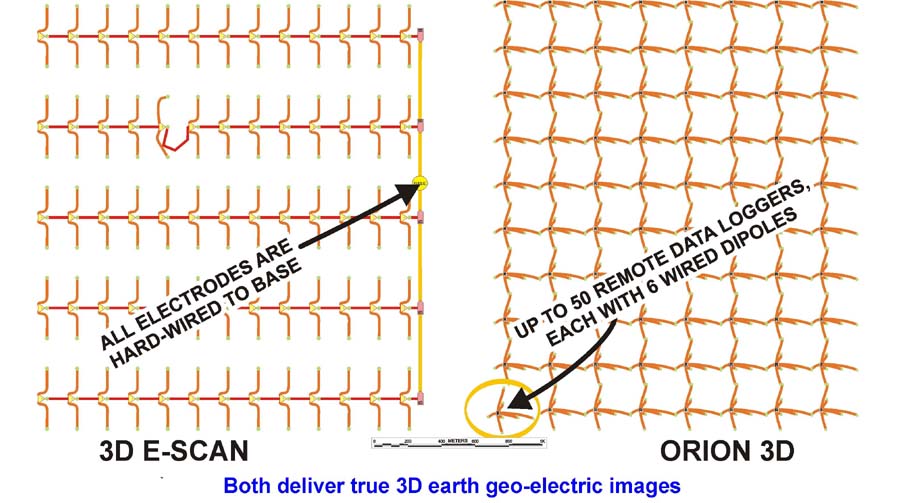
3D E-SCAN also covers the survey area with a pre-installed electrode system, expandable to any size.
While ORION can measure only derivative signals (voltage differences) across its hard-wired dipoles,
E-SCAN measures the fundamental, absolute voltage at each electrode. For each current injection site, E-SCAN numerically defines the entire resulting potential field, instead of sampling slope values (derivatives).
E-SCAN's stronger pole-pole signal levels routinely sample to twice the depth of the ORION's combined pole-dipole and MT data sets.
The result is that 3D
E-SCAN's dense, all-directional DC resistivity data set
is continuous through its maximum survey depth (rather than two separate, layered data sets, i.e. DC resistivity + MT).
E-SCAN's uniform field data set inverts seamlessly to full depth, avoiding the resolution disturbances that occur in crossing ORION's DC/MT transition zone.
Both ORION and E-SCAN will deliver field data sets that will support a competent 3D inversion model of the earth. E-SCAN's choice of measurement array supports deeper data acquisition at higher signal levels, in a single, more uniformly-constrained 3D inversion model.
BOTH 3D SURVEY APPROACHES DELIVER COMPETENT 3D EARTH MODELS ...
... BUT 3D E-SCAN'S NON-DERIVATIVE SYSTEM DELIVERS
STRONGER, DEEPER 3D RESULTS AT LOWER COST.
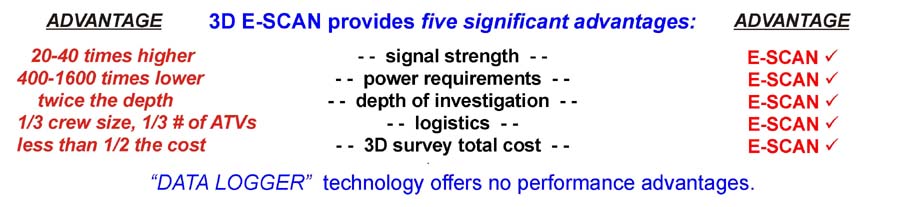
The first 3 advantages relate to 3D E-SCAN's ability to measure the absolute potential field voltages,
rather than the much-diminished lateral derivatives of these voltages.
The reduced power requirements of E-SCAN result from having very high signal return, per amp of transmitted current.
High signal return also keeps transmitted voltages* lower and safer, achieving a significantly reduced risk of injury to crew, livestock, and work area visitors on every survey.
E-SCAN's smaller crew and lower costs are consistently demonstrated over several decades of field survey success, even in extreme terrain conditions. A superior hardware system design and flexible field deployment procedures extend the range of True 3D applicability to projects much larger or much smaller than is practical with a data logger system.
3D E-SCAN's signal-optimized technology keeps its survey costs in the ballpark with conventional line-based surveys, for example a 10 or 12 line pole-dipole DCIP survey.
* Some jurisdictions are establishing upper limits on survey voltages (e.g. the European Union,
at 1,000 volts maximum).
90% of 3D E-SCAN surveys have been completed using 1,000 volts or less, so compliance with EU and other regulations is not a problem.
Derivative-measurement systems (pole-dipole and data-logger 3D systems) with an average 30-fold disadvantage in signal strength
may be forced to resort to costly electrode contact enhancement
procedures in order to obtain sufficient signal levels for a survey,
within this maximum permitted voltage.
Recon3D E-SCAN - THE RECONNAISSANCE MAPPING SYSTEM
THAT 3D-VERIFIES ITS ANOMALIES EN ROUTE, IN REAL TIME.
For every conductive anomaly that it encounters,
Recon3D E-SCAN's low-cost single-line reconnaissance mapping system can be expanded
into a cross-line 3D verification stage, then to optional True 3D or fs3D 3D E-SCAN survey coverage, before the crew departs the area.
Exploration projects that target large scale conductive bodies qualify for time- and cost-saving power of LINEAR E-SCAN, employing the cross-line strategy that delivers True 3D drill targeting in real-time response to early data patterns.
In conductive body exploration*, the traditional practice of using grids of parallel survey lines for DC resistivity data gathering is replaced by a far more certain (and cost-effective) strategy in which only the field data that are required for best-possible 3D target constraint (during data inversion) are collected. Real-time reaction to updated 3D models of accumulating field data effectively guides the field survey strategy toward completion of True 3D data acquisition, even for cases with multiple conductive bodies.
A section covering the cross-line strategy will appear soon on this website. Until then, a PowerPoint presentation is being used to explain the geophysics and show case results from the field. Contact Greg at 289 221 3604 for more.
* examples: unconformity uranium, IOCG, geothermal alteration and plumes.
LINEAR E-SCAN's optional seamless expansion into cross-line (True 3D, above left) and full 3D E-SCAN (fs3D, above right)) modes permits a client to secure definitive True 3D or fs3D data imagery for any anomalous conductive body that may be encountered on an initial LINEAR E-SCAN reconnaissance traverse.
The cross-line 3D-inverted model at left has captured all of the important details of the conductive anomaly system with just four
guided cross-lines, confirming the lateral limits of the area of interest so that further stages of exploration can be planned. The time and cost to get to this advanced stage of target understanding has been remarkably low.
As with all E-SCAN technologies, the project operator (and, optionally, the client's people) has the
unique ability to monitor the hour-to-hour building and verification of the cross-line conductive anomaly pattern, in
diagnostic 3D. Using the up-to-date 3D inverted model results at left, the client is presented with the real-time option to expand upon the existing field survey system installation, already in place and paid for, to acquire and deliver the Full Spectrum 3D (fs3D) model shown at right. fs3D provides optimum resolution of context details, including the deep structure observed (in this specific case) along three principal axes, and also objectively resolves all resistive features (key parts of any comprehensive geothermal system signature). 3D drill targeting of the conductive anomaly could proceed immediately and confidently on the basis the cross-line 3D model, for example in a case where the client needs to confirm a potentially economic cause for the anomaly, before committing to further exploration costs. If initial shallow thermal-gradient drilling of the cross-line 3D conductive-zone patterns (at left) reveals no large-scale anomalous thermal regime, why spend more money than you have to on a project where a principal component (elevated temperatures) has just been shown to be non-existent?
"DCIP" refers to DC resistivity and Induced Polarization (IP) surveys, which cover all
of the electrical geophysical techniques involving injection of electrical current
directly into the ground, and measurement of the resulting
DC electrical potential
field's characteristics at various distances away from the current injection point.
The measurements are usually at surface, but underground and down-hole injection
and/or measurements are done for special purposes such as hole-to-hole tomography
or
mise-a-la-masse mapping.
Thousands of these surveys have been done since 1950,- you know them as dipole-dipole
and pole-dipole surveys, Schlumberger soundings, gradient array and Real Section surveys,
pole-pole surveys, Wenner surveys, 3D E-SCAN surveys, and the upper 1000m component of
TITAN 24 and ORION 3D surveys.
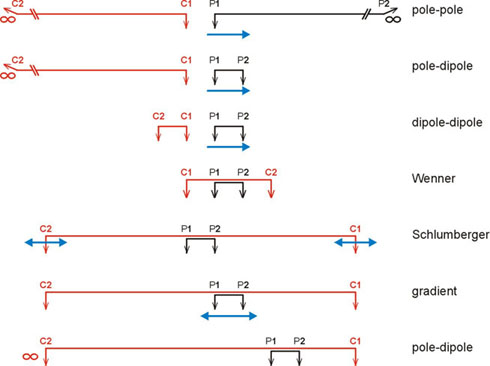
All on-surface survey measurements involve 4 electrodes, 2 for current injection and
2 for signal (voltage) measurement, arranged in various configurations called arrays:
"Diagnostic 3D" is the 3D inverted model of all field data acquired to date.
Continuously updated while the field survey is in progress, this model helps to
determine where the next cross-line should be placed, to acquire the identifiably-
missing hard data that are needed for more complete constraint of the developing
conductive anomaly. Together with examination of compilations of 3D-pseudosection
field data, this real-time diagnostic exercise ensures that all necessary field data
constraints are acquired before the field survey moves on or terminates.
This includes evaluation of any signs of additional, adjacent, as-yet unresolved
conductive bodies, and any anomalies which may lie at, near or beyond the present
limits of line-survey coverage. Every recommended cross-line has a demonstrated
purpose or objective for its expected field data increment, and virtually no field
data are acquired without such a purpose being clearly understood in advance.
The result is the certifiably complete hard-data containment and definition of all
conductive anomalies within the cross-line survey's swept area, each anomaly meeting
True 3D drill targeting standards, plus a bonus: the reduction of the wasted time and
field costs that arise from unguided (unnecessary) conventional field survey lines.
When this survey crew is demobilized from the field, you know for certain that
there will be no later regrets, no "what-if's" provoked by too-late imagery of
near-edge, unresolved anomalous conditions that really should have been fully resolved
to "drill or no-drill" status while the survey system was still there, set up on site.
LINEAR E-SCAN is most effective for relatively conductive targets,
though they need not be of EM conductivity grade.
Just relatively anomalous, compared to the host rock resistivity.
Ground follow-up to ZTEM airborne surveys is an example application.
The valley-bottom LINEAR reconnaissance sweeps in search of geothermal
system conductive manifestations, seen at left, is another.
IOCG bodies constitute an obvious large-area reconnaissance target.
Conventional DCIP transmitters deliver up to 3200 or 4500 volts DC
(up to 9000 volts, using two transmitters in serial, e.g. in the Athabasca Basin).
95% of E-SCAN surveys use transmitted voltages of 450 to 1200 volts maximum,
so compliance with regulatory limits of 1000 volts is easily met with full signal.
Due to high signal return (per applied volt), even super-deep 3D E-SCAN surveys
can function at less than 1200 volts. For example, in Dixie Valley, Nevada,
3D E-SCAN data were routinely collected to 5000 metres below surface to resolve
the 3D image of a major hydrothermal outflow system hosted in extreme desert
conductivities of 0.5 to 2 ohm-metres. Average transmitter voltage: 650 V.
Maximum Transmitter voltage: 1200 V, for less than 5% of the data.
The greater the distance between the measurement electrode(s)
and the current injection site, the deeper (and laterally wider)
the effective earth sampling for that measurement.
May present text and/or supplementary graphics to elaborate on a concept or definition.