For decades 3D E-SCAN has delivered the high density, uniformly distributed, fully multi-directional
field data
required by modern 3D inversion programs in order
to deliver objective, full-spectrum 3D earth resistivity mapping. Recently, a new approach to 3D data acquisition has become available, using data loggers, presented by Quantec Geoscience as ORION 3D.
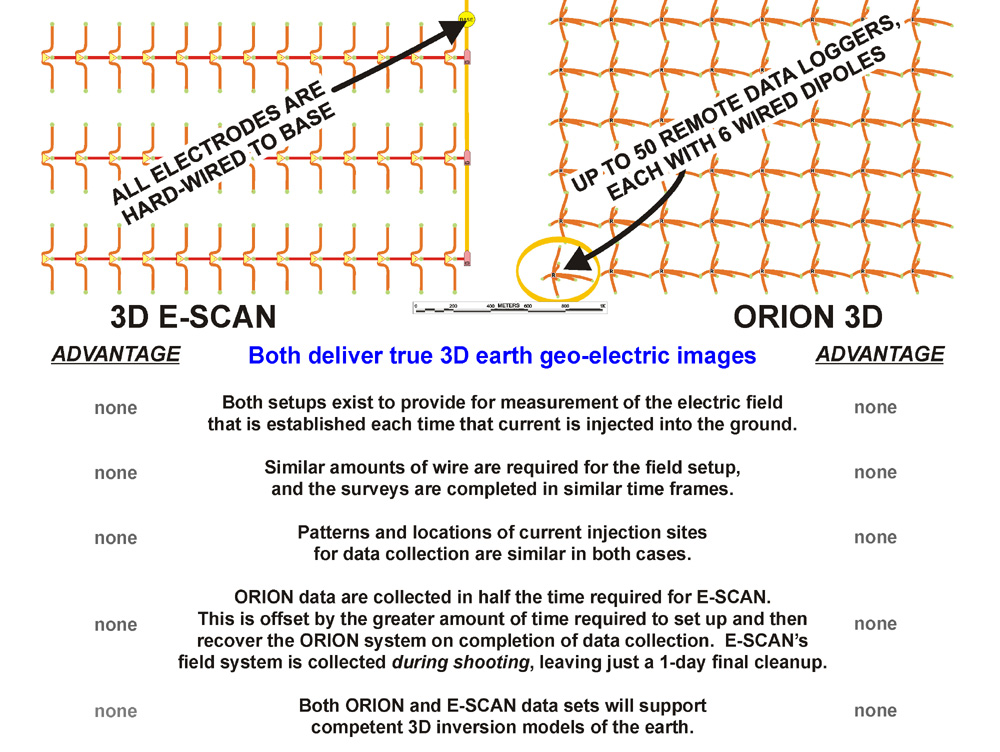
Both 3D E-SCAN and ORION 3D deliver comprehensive, full-spectrum, highly objective 3D geo-electric earth imaging that provides the sensitivity and resolution needed for the current demands of true 3D geophysical exploration mapping.
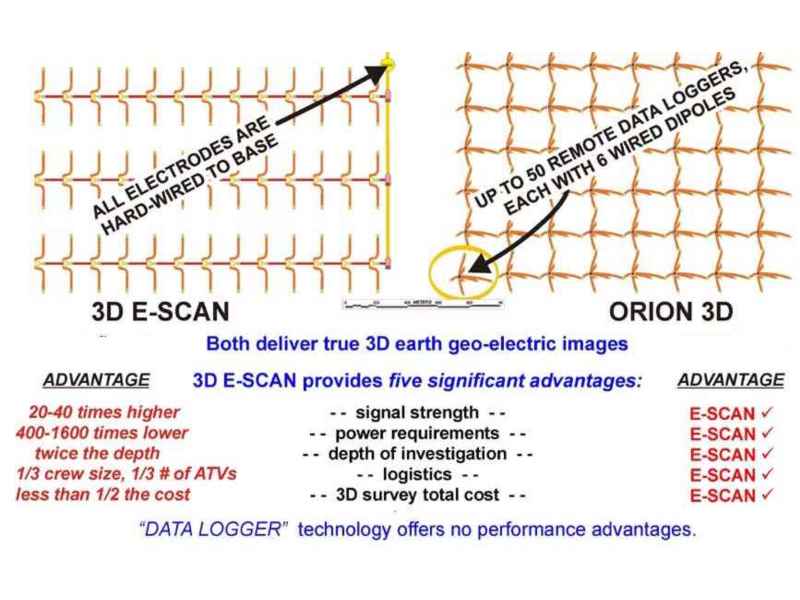
With similar results assured, differences in operational cost and effectiveness will guide your choice of method. Here, 3D E-SCAN outperforms in all categories.
Who should be interested?
- All users of 2D and 3D IP and resistivity surveys, CSAMT and various EM ground surveys, anywhere.
- Explorers experiencing difficulties in mapping epithermal gold targets and other resistive systems.
- Explorers in difficult terrain or complex conditions.
- Anyone involved in mapping precious metals, uranium, geothermal, diamonds, hydrocarbons, base metals, groundwater, civil engineering, archaeology...
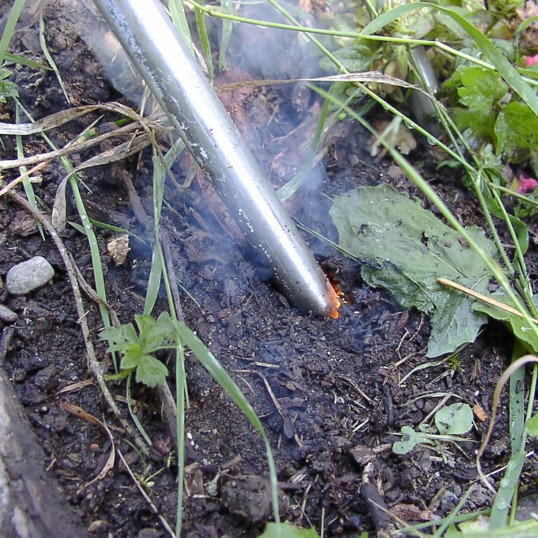
Using a pre-installed pattern of electrodes, E-SCAN and ORION measure signals arising from
electric current being injected at one of many hundreds of points located throughout the survey grid area.
The current injection strategy and the transmitter equipment are essentially identical.
Measurements are made using the established remote-accessed electrodes.
ORION 3D's data loggers measure signal across electrode dipoles, while the 3D E-SCAN measures at single poles,
referenced to a hard-wired remote site.
ORION MT relies upon MT measurements to increase the total depth of investigation,
while 3D E-SCAN doesn't need MT,- its DCIP data already sample much deeper.
The considerable advantages of true 3D inversion earth modeling are supported by both technologies.
So,- where is the difference?
The website details how data logger systems are technically forced to settle for measuring only derivatives of the available ground
signals while E-SCAN's superior field system measures the full-strength fundamental potential field voltages. Years ago,
E-SCAN engineers abandoned the data loggers' dipole measurement approach, when its disadvantages became apparent.
signals while E-SCAN's superior field system measures the full-strength fundamental potential field voltages. Years ago,
E-SCAN engineers abandoned the data loggers' dipole measurement approach, when its disadvantages became apparent.
Both 3D E-SCAN and ORION 3D deliver dense, uniformly-distributed, all-directional true-3D
field data sets for 3D inversion processing.
ORION's adoption of data logger technology is apparently de rigueur today, promoted as the new leading edge technology.
Perhaps not. At left are five of a longer list of data quality, operational and cost advantages that 3D E-SCAN has
field-proven over decades of true 3D mapping.
This "new technology" data logger strategy
delivers lower performance at higher cost.
The rest of this presentation explains
the hard science and simple logic
behind E-SCAN's 3D performance, in
comparison to line-based surveys.
For more on E-SCAN vs ORION,
refer to the website.
delivers lower performance at higher cost.
The rest of this presentation explains
the hard science and simple logic
behind E-SCAN's 3D performance, in
comparison to line-based surveys.
For more on E-SCAN vs ORION,
refer to the website.
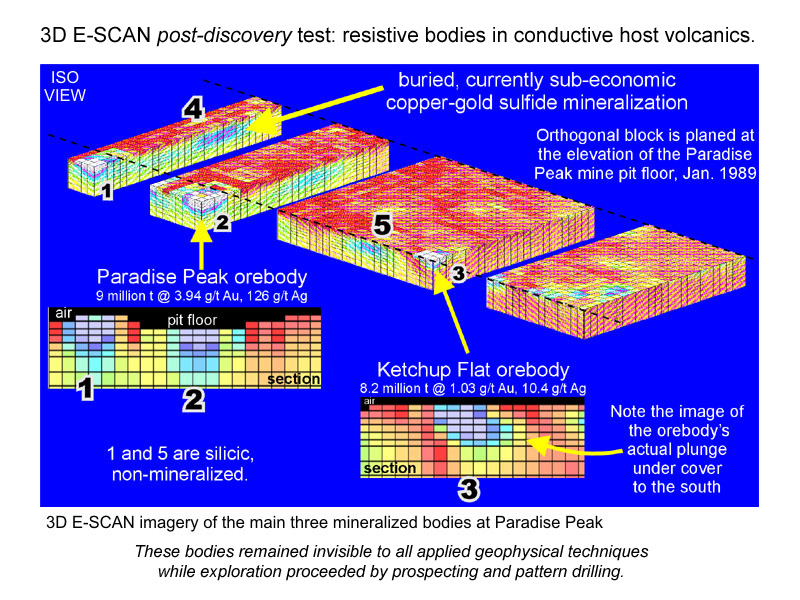
3D imagery from E-SCAN suggests that many of Nevada's prospective volcanic-hosted epithermal gold areas remain only partially evaluated.
Resistive features and subtle alteration patterns have remained undetected by the pre-3D field survey technologies.
3D E-SCAN's unique ability to map these resistive targets is matched by affordable costs, even in difficult terrain.
3D E-SCAN's unique ability to map these resistive targets is matched by affordable costs, even in difficult terrain.
The key to successful imaging of resistive epithermal systems lies in the acquisition
of a dense, multi-directional true 3D raw data set.
As powerful as 3D inversion algorithms may be, they can only work with the information that is provided in the supplied raw field data set.
If the supplied data set is sparse, perhaps from a line-based (uni-directional) dipole survey,
the resulting 3D earth model will show only those features that are robust enough to ensure recognition by the inversion algorithm. No useful subtleties.
When the field data set samples in dense, all-directional true 3D, the data set itself forces the inversion algorithm to present far more detail, including the
elusive resistive features and previously unseen, subtle alteration patterns.
This website shows many case history examples of previously "undetectable" orebodies whose diagnostic signature is finally revealed as a result of
intense true 3D survey sampling and 3D inversion.
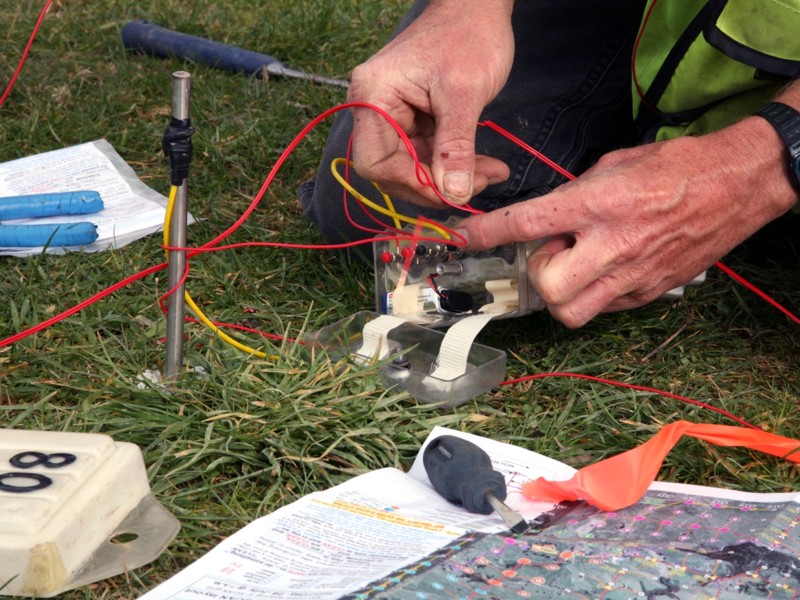
This switch box controls three survey electrodes. Its independent microprocessor communicates with the central controller,
confirming actions and providing for verification of electrode contact conditions to ensure competent data.
confirming actions and providing for verification of electrode contact conditions to ensure competent data.
E-SCAN's electronic switching devices instantly adapt to extreme topography and complex setup situations, leaving line-dependent surveys far behind. By avoiding use of multi-conductor cables for electrode access, numbers are expanded beyond the usual 8 to 24 electrodes to more than 300 electrodes at a time, located not just along a line but everywhere across the survey area.
Setup flexibility: Below, the field crew's working map shows options for offset placement of electrodes in an area of dangerous cliffs. Any corner of the cell-sized white box is available as a safer alternative to the nominal (grey dot) site.
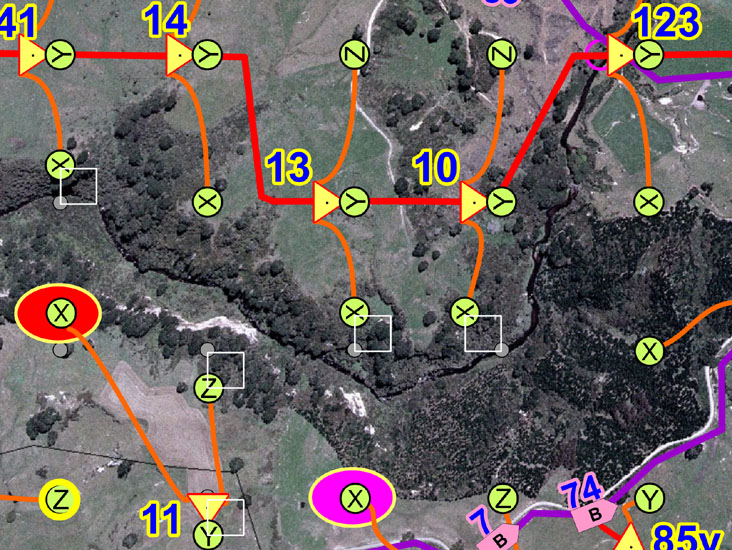
3D E-SCAN setup is independent of any pre-survey orientation guesses.
It will uniformly measure in every orientation, eliminating any chance
of a bad or unlucky directional commitment at the outset.
It will uniformly measure in every orientation, eliminating any chance
of a bad or unlucky directional commitment at the outset.
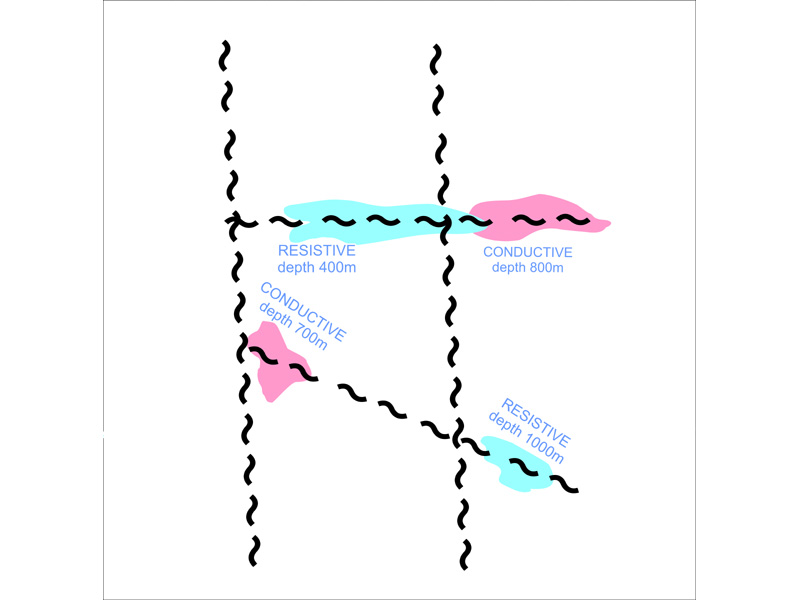
For illustration, four anomalous bodies are buried at different depths, in association with a system of major north-south structures and two crossbreaking structures.
Conventional survey planning requires pre-survey guessing of what orientations may be most significant, so that survey lines can be oriented accordingly (perpendicular to expected structures or to the long axis of target bodies).
In the absence of prior estimates of probable target orientations, any survey orientation is chosen, usually to take best advantage of site operating conditions by avoiding obstacles, or by using an existing road as a base line.
If you had to choose just one (e.g. you are planning a conventional line-based survey), which orientation would you select for this model:
- main north-south fault structure illumination (uses east-west lines) or
- crossbreaking structure illumination (uses north-south lines).
Either way, critical data will be missed and any 3D earth model will be incomplete or misleading, even though the model will look nicely "geological" and exhibit a "good fit to the data".
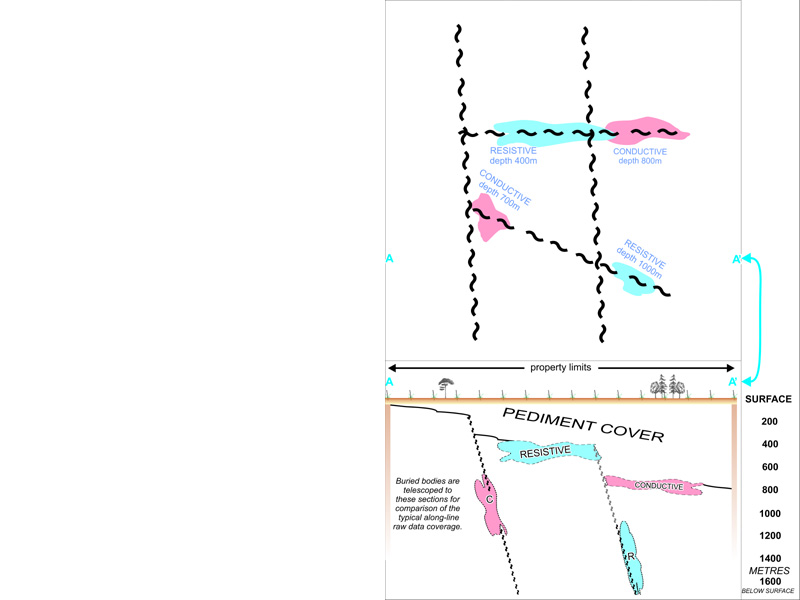
These test results and the test itself are scaleable. Instead of the 200 metre station spacings used here,
you can substitute 15 metres or 400 metres, and adjust the vertical scale accordingly.
you can substitute 15 metres or 400 metres, and adjust the vertical scale accordingly.
Getting ready...
We'll look at raw data "pseudosections" that will cross each of these four bodies,
showing the actual nominal depth of investigation for the field measurements.
The depth of investigation* varies according to the electrode pattern (array)
that is used across the survey area's surface.
This test model's buried bodies have been telescoped onto this single section,
so that in a single representative section (pseudosection) we can see how the various data sets will plot in relation to the target bodies.
3D E-SCAN vs ORION 3D note: While the comparison here will be between 3D E-SCAN's pole-pole data type
and the pole-dipole array data of a deep conventional survey, you'll note that the measured data from ORION 3D's field setup
is also pole-dipole. ORION may share the uniform lateral distribution characteristics of E-SCAN's data set, but the depths measured will
be plotted on the scale of the conventional pole-dipole data set,- about half as deep.
For information on plotted "depth" for various arrays, see:
Edwards, L.S. 1977. A MODIFIED PSEUDOSECTION
FOR RESISTIVITY AND IP: Geophysics, vol. 42
and graphic explanations elsewhere on this website.
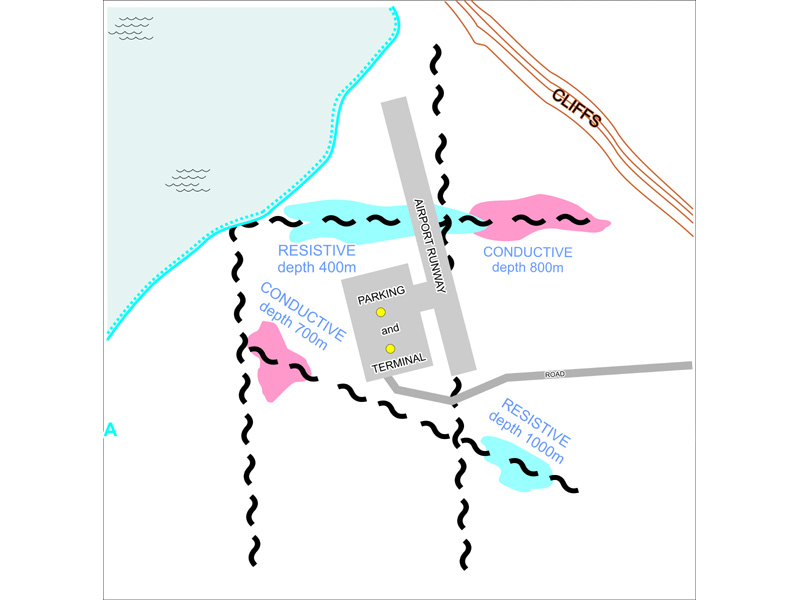
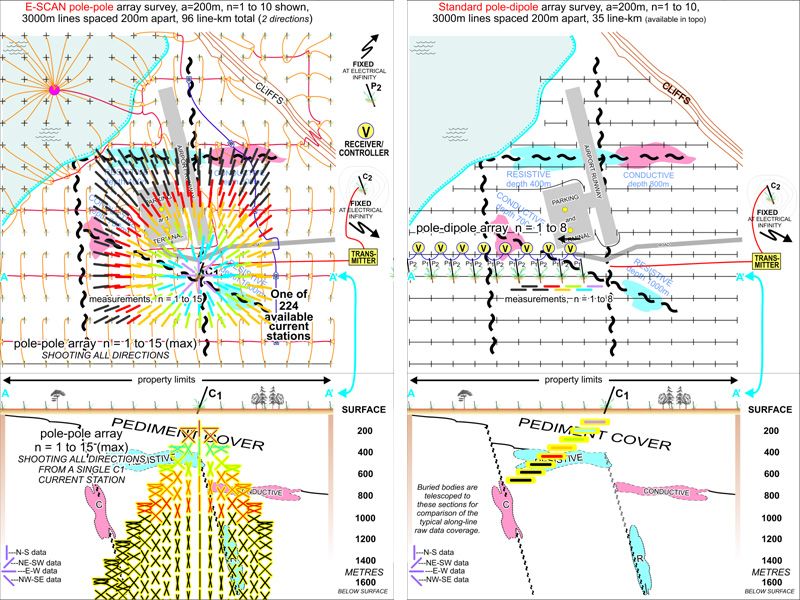
A lake, cliffs and an airport facility with asphalt-paved runways and parking areas are added.
This is a reminder that survey data sets are susceptible to gaps in data caused by site obstacles.
The lake and cliff area are avoided here. While lines could be installed up and over the
cliffs with some difficulty, the lake area would likely remain excluded from survey testing.
cliffs with some difficulty, the lake area would likely remain excluded from survey testing.
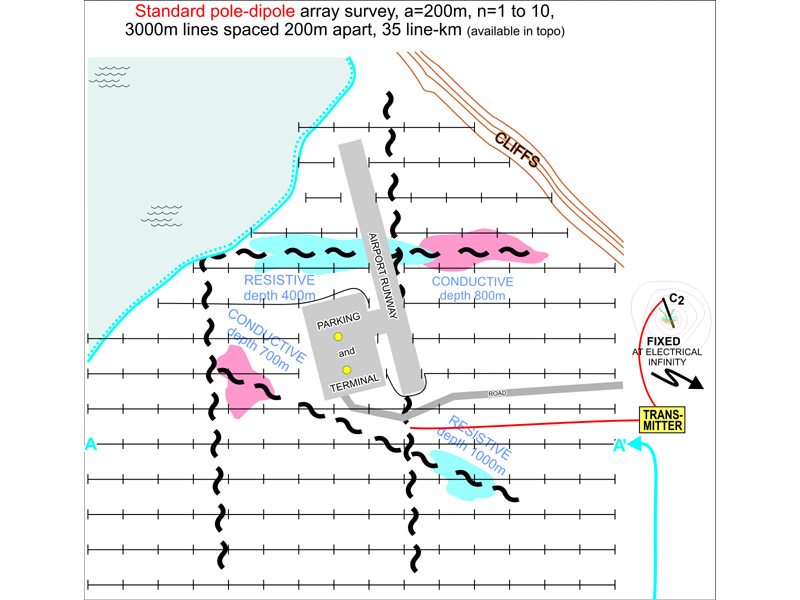
E-SCAN field data will be compared to those generated by a pole-dipole array survey, as laid out on the grid lines shown here. The pole-dipole array was chosen because it delivers the highest performance of the conventional exploration survey arrays, for example providing deeper penetration and greater signal return than the dipole-dipole or any other commonly-used array.
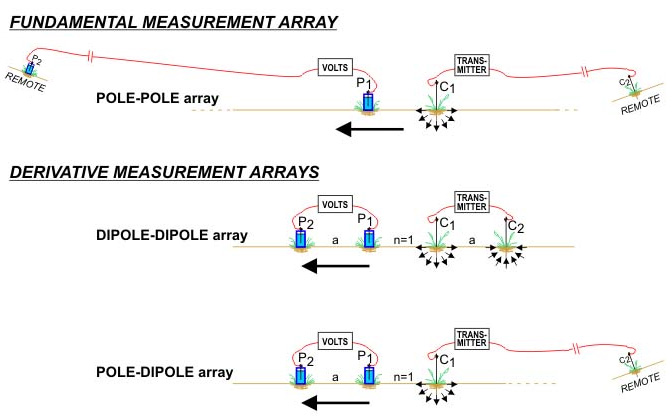
The two most-used survey arrays and E-SCAN's pole-pole array are closely related.
E-SCAN is the ultimate in operational flexibility. The lake area is wired (and later "shot") with with a total of a single day's added time and cost. The cliff area is fully wired and shot with no delay or extra cost at all. In the airport area, only two stations are missed,- the yellow dots in the parking lot.
All of the 3D E-SCAN electrodes that will be used during the survey are installed at the outset, rather than a few at a time as with conventional surveys. This usually takes about 3 days. Once shooting starts, the electrodes needed for any measurement are selected, connected (and tested) in a fraction of a second, through the network of microprocessor-controlled switching devices ("boxes") introduced earlier.
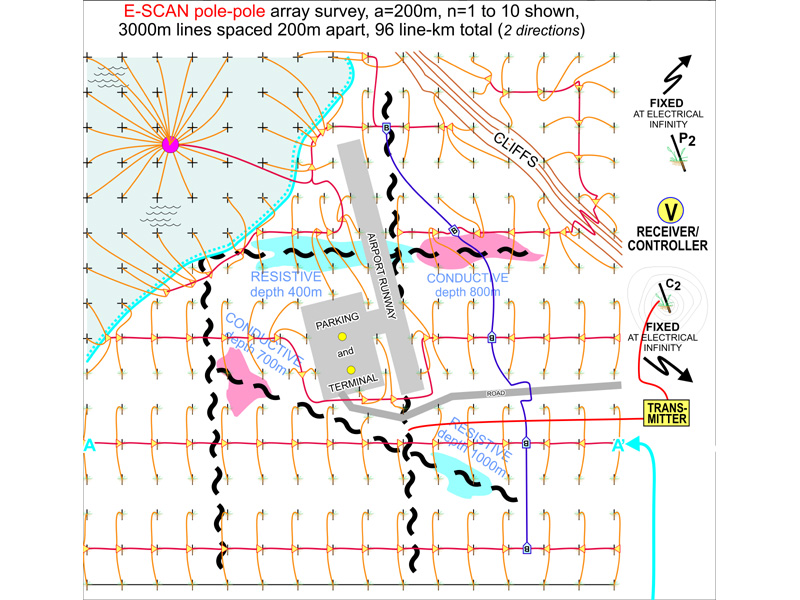
In every DC resistivity (and IP) survey, current injected into the ground flows in all directions, establishing an electric potential field that can be detected at surface. Distortions in the observed potential field are clues to the subsurface variations which affect the density and direction of current flow.
One current injection site (C1), and its resulting potential field, are shown here. When the current injection site is moved along the line, a different potential field is generated, and again sampled.
E-SCAN's survey setup at left will utilize 224 different current injection sites, including some in the lake bottom. The pole-dipole survey at right will employ 154 sites. This means the surveys will sample, respectively, 224 and 154 different electric potential fields in the course of completing their field data acquisition.
These field data will be used to interpret the resistivity conditions that must exist in the subsurface in order to have caused the observed potential field patterns at surface.
The electrode and instrument setup for eight pole-dipole array measurements is shown here. At the electrode "C1", current is injected into the earth to establish the electric potential field that will be measured. In traditional surveys, the measurement receiver (V) is connected to a pair of electrodes (the measurement dipole P1-P2), and the voltage difference is measured and recorded. The measurement setup is then advanced to the next dipole for another measurement, and so on until 7 or 10 dipole separations have been measured from the single C1 current input. The C1 input site is then advanced one station down the line, and the 7 to 10 measurements are repeated to sample the new potential field.
For each measurement, we show a colored line or tic, here in plan view, oriented to show the current flow direction for the measurement, and positioned at a point half way between the current electrode C1 and the nearest electrode (P1) of the measurement dipole P1-P2 used for the measurement. In this setup, only 8 of the planned 10 measurements is obtained because the survey encounters the end of the line at n=8.
The eight measurements plotted in plan view in the previous image are shown here in a section through the earth, plotted at their effective mean depth of sampling (that nominal depth value computed for comparison purposes using a uniform earth situation). The orientation of the measurements is east-west, as indicated by the orientation of the "tic".
Above - current going into the ground at C1.
For information on plotted "depth", see references: Edwards, 1977, and graphic explanations elsewhere on this site.
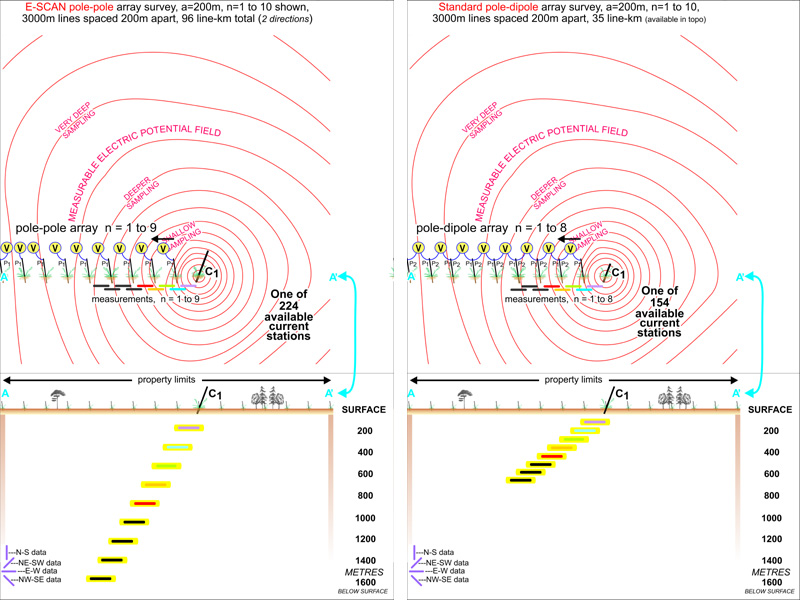
There is enough room for nine pole-pole array measurements in the images at left. They too are oriented along the line, and in plan view plot in similar positions. In the section, the superior depth penetration of the pole-pole array data is evident, but the data set remains sparse and uni-directional, still very limited in usefulness. Remember, the same group of electrode locations is used for each set of data, the only difference being the employment of a second remote reference circuit to allow the pole-pole array to sample the potential field voltage with just one on-grid electrode P1.
This shows why we bother to set up all of the electrodes in one go, rather than spreading the same amount of work out over the duration of the survey.
The same potential field, from the same current injection site C1, is now sampled in 224* different locations by the full E-SCAN field setup. This requires about the same amount of time as would be required to make the 8 conventional pole-dipole measurements, i.e. about half an hour.
The close-in tics sample the shallower potential field information, while the outer black tics represent extremely deep sampling from electrode stations at the extreme edges of the survey grid setup. Note the uniform distribution and all-directional nature of the measurements originating from this C1 location. For each of the other 223 current injection setups, the resulting potential field will be sampled in a similarly comprehensive manner, each time generating another 224* raw data for later 3D analysis.
This potential field isn't just sampled, it's defined.
* In actual field operations, about half of these 224 measurements would be made, skipping many of the distant shots as being overly-redundant.
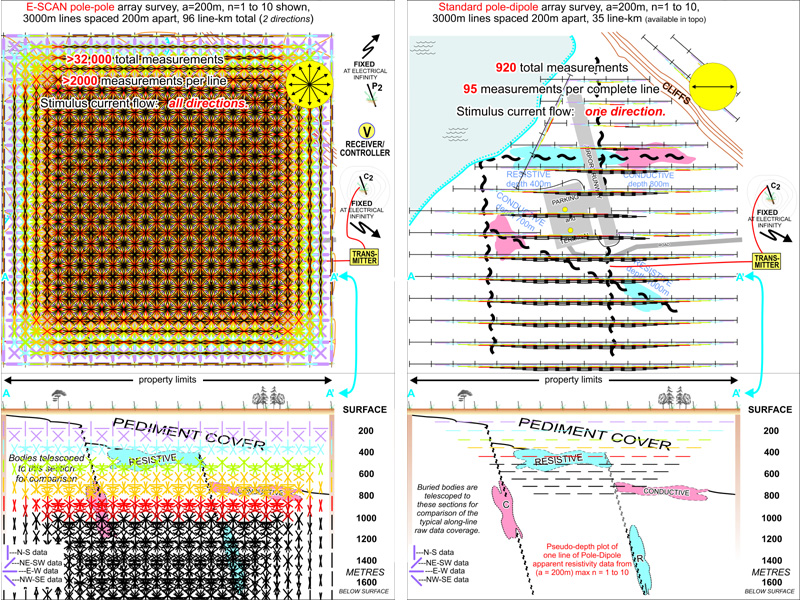
With 224 C1 injection shots completed in about the same time that it would take for the 154 pole-dipole shots, the difference in accumulated field data tells the story of E-SCAN's true 3D resolving power.
Every aspect of the survey area, the lake and cliffs, under the airport, every possible orientation, depth and type of geo-electric feature, all are comprehensively sampled by the E-SCAN data set, providing definitive, CAT-scan-like hard-data constraint for every detail of the objective 3D earth model that is subsequently produced by inversion processing.
Unlike the pole-dipole survey data at right, the E-SCAN data set required no pre-survey guesswork, no parameterization that would emphasize some earth resistivity aspects, while missing or ignoring others.
As the client explorationist, you can say to the E-SCAN geophysicist: "Don't ask me... it's YOUR job to tell ME what is down there." (Even if you choose to reveal some ideas, it makes little difference as to how the survey is conducted, as long as we are getting sufficiently deep raw data to make sure that we effectively test your concepts, along the way.)
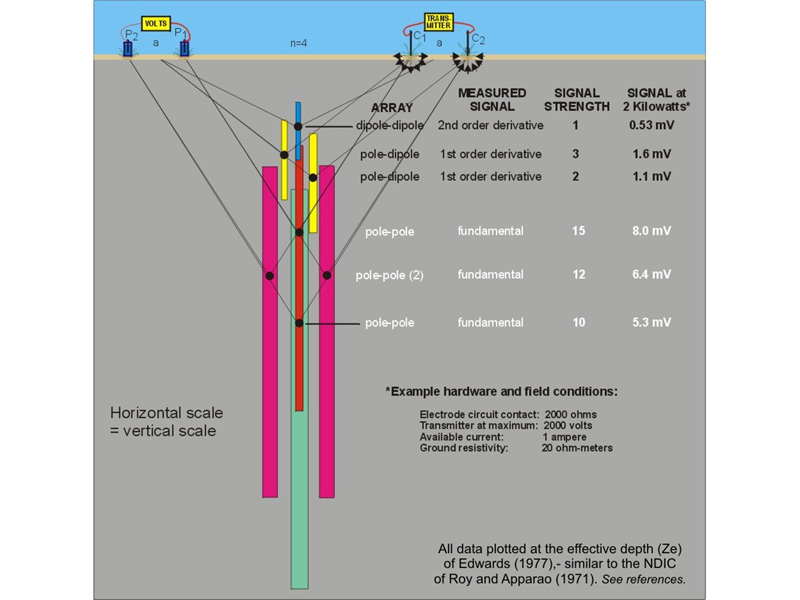
From any 4 electrodes along a line, these array data can be obtained. The superior depth and high-signal characteristics
of the 4 pole-pole data are obvious. The pole-pole data also contain all of the information of the other array data -
pole-dipole and dipole-dipole derivative data can actually be calculated from the fundamental pole-pole data set.
of the 4 pole-pole data are obvious. The pole-pole data also contain all of the information of the other array data -
pole-dipole and dipole-dipole derivative data can actually be calculated from the fundamental pole-pole data set.
Pole-dipole and dipole-dipole array surveys account for most of the exploration IP and resistivity surveys ever done. The pole-pole array has been ignored because it is too complicated to use in exploration-scale surveys. Pity, because the diagram shows a pole-pole measurement four times deeper than the dipole-dipole datum, with its signal level ten times as strong, using the same layout distance along the line, the same electrode positions.
E-SCAN's technology breakthrough eliminated pole-pole's traditional operational difficulties. E-SCAN now cost-effectively delivers an any-terrain true 3D field data set... the high density, uniformly distributed, all-directional, super-deep data that meet every requirement for the objective generation of a true 3D earth model. At left, four in-line electrode sites are used for one dipole-dipole measurement. From those four electrode sites, two deeper, higher-signal, pole-dipole measurements can be made. From the same sites, four even-deeper, higher-signal pole-pole measurements can be made.
The dipole derivatives are what's left over after subtracting two pole-pole data from each other to make one pole-dipole datum, or subtracting two pole-dipole data to get one dipole-dipole datum. The diagram shows the loss of signal and depth information (the colored bars represent 50% of the vertical signal contribution) as each subtraction takes place... a large amount of deep-earth information is subtracted away in the interest of obtaining a faster, cheaper dipole-based field survey. With 3D E-SCAN's fundamentals, no signal or information is ever thrown away.
Better true 3D target resolution and positioning
(and exhaustive condemnation of non-anomalous acreage)
equals fewer drill holes to deliver higher confidence results, at less cost, in a shorter time.
... that's something to consider when you budget
your next geophysics+drilling program.